Welcome to our newly FREE NASCAR DFS Picks and Strategy article for DraftKings and FanDuel. If you’d like access to Awesemo’s premium projections, sign up HERE.
Following Alex Bowman’s first career victory in the NASCAR Cup Series, ever, we all move our gaze south. This week’s festivities take us to the hallowed grounds of Daytona once more. This time under the lights on a Saturday night for the Coke Zero Sugar 400. The second trip to Daytona is one of the more anticipated races each year for the Cup series. Not only do we get a chaotic “plate race” but we also get it under the lights.
Track Preview
Well… not so quick on that whole plate race thing. To be truthful, tomorrow’s race won’t exactly be a plate race as we’ve known it for decades. Going back to the late ’80s, every Daytona race has been marked by the use of restrictor plates in an attempt to limit horsepower. Saturday’s race will employ the use of tapered spacers and everything else that marks the 550 horsepower/ Aero Duct package. Will it race the same as a restrictor plate race? Yes but just don’t call it a plate race around your auto-racing buddies.
So, how do we know that we’re getting a rose by a different name? Take a gander at the Talladega race from earlier this Spring and you’ll see what we’ve grown accustomed to at the 2.5-mile super speedways. Namely – pack drafting, large field consuming crashes, and even the back markers can finish in the top ten.
Roster Construction for the Lazy
Let’s be honest, the majority of people playing NASCAR DFS this weekend won’t be reading this article. Heck, they won’t read any article, paywall or no paywall, because they already know what to do. Yes, I know I address this with every super speedway race but the fact remains the same. The majority of DFS players feel like they have the market cornered on “plate races” and they just blindly follow that guideline. Start guys in the back after whatever starting position you choose, three hours later count all the monies. Names are meaningless, stats have no bearing on today’s race, just turn off your biases and randomly pick those dudes.
If you want to dance with the guy(s) that brought you to prom then be my guest. Go ahead and find your arbitrary starting position. Throw out every single driver above that line. Write names down and randomly pick six drivers out of a hat who start worse than that number you chose. Repeat this exercise twenty times and boom you are a multi-mass-entry player who didn’t even need Fantasy Cruncher!
Roster Construction for People who like Money
Will this path to lineup building be profitable? You bet your red, white, and blue backside it will. However, there are just a few small problems with building rosters this way. If you’re new to NASCAR DFS and this whole pure dart throw approach seems asinine, trust me, it works.
- Everyone else, well more like 75%, will be making their rosters the same way.
- Things just never stay static and we can’t just sit and rest on the idea that NASCAR will too.
We can address these issues with a simple, singular step and have two birds laying on the ground with just one toss of a stone. Let’s comb through the optimal lineups and top ten fantasy scores of past Daytona night races to see if any trends appear. Trends that will shift us from blind stabs in the dark to rational, thought provoked decisions. These trends will shed light on how our lineups should evolve versus the tried and true method. Not only will we make better, more informed choices; these rationales will give us the differentiation we need.
For what it’s worth, I’ll only be referencing the summer races instead of both summer and winter races. Race conditions and scenarios can vary greatly in these two races. The track remains the same but the circumstances make the races different. Thus, I’ll be limiting my data sets just to the July races dating back to 2015.
Daytona 2015
| Driver | Start | Finish | Place Diff | Fast Laps | Laps Led | Total DK Points |
| Denny Hamlin | 35 | 3 | 32 | 1 | 10 | 76 |
| Kevin Harvick | 34 | 4 | 30 | 3 | 0 | 71.5 |
| Kurt Busch | 28 | 5 | 23 | 2 | 0 | 63 |
| Jimmie Johnson | 12 | 2 | 10 | 2 | 35 | 61.75 |
| Ryan Newman | 17 | 8 | 9 | 2 | 1 | 46.25 |
| Landon Cassill | 22 | 13 | 9 | 5 | 0 | 45.5 |
| Casey Mears | 15 | 11 | 4 | 8 | 0 | 41 |
| Joey Logano | 33 | 22 | 11 | 13 | 0 | 39.5 |
| Ricky Stenhouse Jr | 30 | 19 | 11 | 4 | 0 | 38 |
| Austin Dillon | 2 | 7 | -5 | 2 | 8 | 35 |
- Average starting position of the top ten fantasy scores – 22.8
- Average finishing position of the top ten fantasy scores – 9.4
- Drivers who started top ten who finished with a top ten fantasy score – 1
- Started top twenty who finished with a top ten fantasy score – 2
- Those who led more than 10% of the race – 1
- Lead changes – 22
- Real life cautions – 9
- Drivers who did not finish on the lead lap – 15
- Drivers who did not finish the race –
Daytona 2016
| Driver | Start | Finish | Place Diff | Fast Laps | Laps Led | Total DK Points |
| Brad Keselowski | 5 | 1 | 4 | 0 | 115 | 78.75 |
| Michael McDowell | 37 | 10 | 27 | 4 | 0 | 63 |
| Clint Bowyer | 31 | 9 | 22 | 8 | 1 | 61.25 |
| David Ragan | 38 | 16 | 22 | 2 | 1 | 51.25 |
| Joey Logano | 11 | 4 | 7 | 3 | 6 | 50 |
| Kyle Larson | 17 | 6 | 11 | 2 | 0 | 50 |
| Kyle Busch | 3 | 2 | 1 | 1 | 16 | 47.5 |
| Casey Mears | 20 | 12 | 8 | 2 | 2 | 41.5 |
| Ricky Stenhouse Jr | 4 | 5 | -1 | 5 | 0 | 40.5 |
| Reed Sorenson | 39 | 22 | 17 | 2 | 0 | 40 |
- Average starting position of the top ten fantasy scores – 20.5
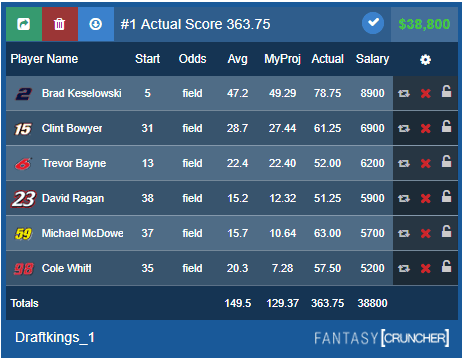
- Average finishing position of the top ten fantasy scores – 8.5
- Drivers who started top ten who finished with a top ten fantasy score – 3
- Started top twenty who finished with a top ten fantasy score – 2
- Those who led more than 10% of the race – 1
- Lead changes – 26
- Real life cautions – 5
- Drivers who did not finish on the lead lap – 16
- Drivers who did not finish the race – 9
Daytona 2017
| Driver | Start | Finish | Place Diff | Fast Laps | Laps Led | Total DK Points |
| Brendan Gaughan | 32 | 7 | 25 | 8 | 0 | 66 |
| David Ragan | 30 | 6 | 24 | 4 | 4 | 65 |
| Paul Menard | 24 | 3 | 21 | 2 | 0 | 63 |
| Michael McDowell | 23 | 4 | 19 | 6 | 0 | 62 |
| Ricky Stenhouse Jr | 6 | 1 | 5 | 7 | 17 | 58.75 |
| Corey LaJoie | 36 | 11 | 25 | 0 | 0 | 58 |
| Ryan Newman | 22 | 5 | 17 | 2 | 0 | 57 |
| Chris Buescher | 29 | 10 | 19 | 0 | 0 | 53 |
| Clint Bowyer | 11 | 2 | 9 | 1 | 4 | 52.5 |
| Matt DiBenedetto | 28 | 13 | 15 | 3 | 0 | 50.5 |
- Average starting position of the top ten fantasy scores – 24.1
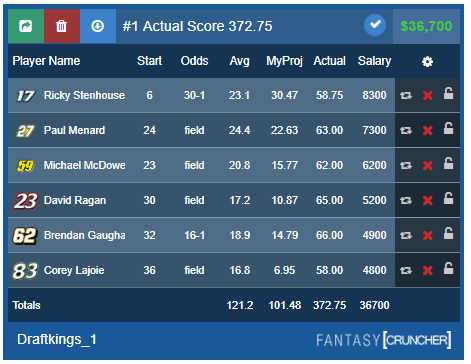
- Average finishing position of the top ten fantasy scores – 6.2
- Drivers who started top ten who finished with a top ten fantasy score – 1
- Started top twenty who finished with a top ten fantasy score – 1
- Those who led more than 10% of the race – 0
- Lead changes – 33
- Real life cautions – 12
- Drivers who did not finish on the lead lap – 19
- Drivers who did not finish the race – 16
Daytona 2018
| Driver | Start | Finish | Place Diff | Fast Laps | Laps Led | Total DK Points |
| Erik Jones | 29 | 1 | 28 | 9 | 1 | 78.75 |
| Matt DiBenedetto | 31 | 7 | 24 | 3 | 0 | 62.5 |
| Martin Truex Jr | 13 | 2 | 11 | 8 | 20 | 62 |
| Chris Buescher | 25 | 5 | 20 | 2 | 0 | 60 |
| DJ Kennington | 35 | 13 | 22 | 1 | 0 | 56.5 |
| Ty Dillon | 19 | 6 | 13 | 5 | 3 | 54.25 |
| Ray Black Jr | 39 | 16 | 23 | 0 | 0 | 51 |
| JJ Yeley | 40 | 18 | 22 | 0 | 0 | 48 |
| Darrell Wallace Jr | 22 | 14 | 8 | 2 | 0 | 39 |
| Ryan Newman | 7 | 8 | -1 | 7 | 1 | 38.75 |
- Average starting position of the top ten fantasy scores – 26
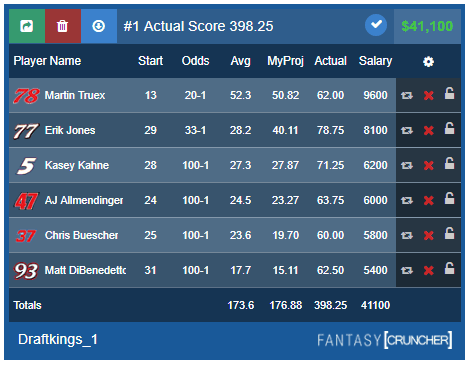
- Average finishing position of the top ten fantasy scores – 10
- Drivers who started top ten who finished with a top ten fantasy score – 1
- Started top twenty who finished with a top ten fantasy score – 1
- Those who led more than 10% of the race – 1
- Lead changes – 25
- Real life cautions – 8
- Drivers who did not finish on the lead lap – 23
- Drivers who did not finish the race – 20
And this means what?
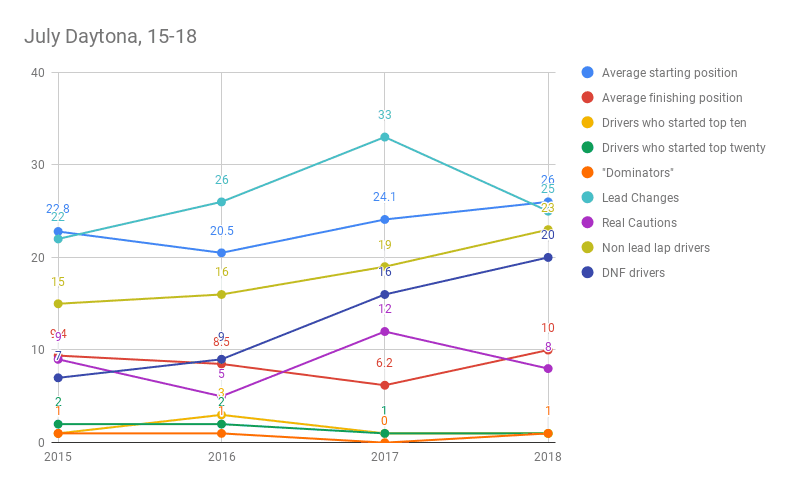
If you’re into easily misleading graphs then have fun dissecting the above data. If you, however, hate line graphs then here’s all the above information in an easier to read table.
| 2015 | 2016 | 2017 | 2018 | |
| Average starting position | 22.8 | 20.5 | 24.1 | 26 |
| Average finishing position | 9.4 | 8.5 | 6.2 | 10 |
| Drivers who started top ten | 1 | 3 | 1 | 1 |
| Drivers who started top twenty | 2 | 2 | 1 | 1 |
| “Dominators” | 1 | 1 | 0 | 1 |
| Lead Changes | 22 | 26 | 33 | 25 |
| Real Cautions | 9 | 5 | 12 | 8 |
| Non-lead lap drivers | 15 | 16 | 19 | 23 |
| DNF drivers | 7 | 9 | 16 | 20 |
The correlation is as the wrecks rise in a race so also does the starting position of the top ten average scores. If you’re having trouble making heads or tails of this, let me simplify this. More wrecks mean more cars who started top ten/ fifteen/ twenty wrecked out and thus the higher number. Fewer wrecks mean fewer cars wrecking out (duh) and thus the number falls. In other words, more wrecks mean a higher average starting position for the top ten scores.
Thus, what sort of event are you expecting to witness Saturday? A wreck-laden contest means a larger slice of your player pool hovers around a higher starting position. Meanwhile, a subdued event raises that arbitrary line higher and thus a bigger player pool. Think of it as a slide rule. As the wrecks go up so does your player pool line. As the wrecks go down so also that line.
Perhaps of most importance: don’t miss the forest for the trees. When I speak of this number I speak in the general sense of the majority of where your player pool is coming from. Yes, you could just exclude everyone who starts above that starting number. However, we’ve seen that drivers from the top ten/ twenty are making their way into top ten fantasy scores. Thus, totally shunning those drivers is a sure fire way to not hit be close to the optimal. If your aim is just to be profitable in a chaotic race then go ahead and play the fade game. However, if you want a shot at the top of the leaderboards you will have to expand your pool above that line.
Roster Construction Template
While not fantasy NASCAR gospel, these are the general rules you should abide by when building lineups for Saturday’s race.
- Don’t chase dominators. A July 2016 scenario is highly unlikely of repeating itself so don’t worry about the exception thinking it might be the rule. There will ultimately be a few drivers who lead 20+ laps but history shows us these drivers don’t win. History also shows us they lose enough place differential their laps led points end up being worthless anyways. In the end, we don’t chase lap leaders we chase place differential at Daytona. Oh and fast laps, the draft randomly disperses them throughout the field so even more reason to not worry about a Hog.
- Find a line between 20th to 30th and let 80% of your player pool come from beyond that point. Don’t be afraid to have exposure to drivers starting further than that point. However, just one to a maximum of two per lineup of those latter drivers. Furthermore, don’t be afraid to embrace those backmarkers who start in the 30s. This type of racing places their equipment on an even field with the top teams.
- Embrace the stacks where they present themselves. Time and time we see drivers from the same team or even the same manufacturer literally team up with one another. Super speedway races are where alliances, no matter how shaky they may be, manifest themselves; i.e. Chevrolets at Talladega and Joe Gibbs at Daytona.
- The salary cap is meaningless. If you make a lineup with the above criteria that have thousands of dollars left over in cap space don’t worry. Choosing lineups based off place differential upside will mean avoiding high priced drivers who qualified too far forward. Take another gander at those optimal lineups from the past three years and notice what you see. Lots of salary left over, in every case over $8000. I’m not saying that having that much salary cap left over is the aim of the game. However, if you try to fill in every last dollar you are not playing NASCAR DFS correctly this weekend.
Cash Game Picks
The aim of cash this week is simple – pick six drivers with a high place differential floor. Preferably these drivers will start 20th or worse. Drivers who are more optimally suited for cash game plays have their starting position highlighted in green.
Tournament Game Picks
There are only two real ways to differentiate yourself this week and I’ve already discussed them. First, you either add drivers to your player pool who start in the teens or even single digits. Second, you add drivers starting in the 30s who would normally finish a race several laps down. Drivers who start far enough forward they are no longer safe for cash will have their position highlighted in orange. These drivers have a higher chance of ending with single digits or negative points. However, they also contain the ability to end with a top-ten score while coming in with much lower ownership than the green drivers. Meanwhile, my preferred punts are highlighted in pink.
No individual picks? Let’s be honest, driver picks are pretty self-explanatory this weekend and any “in depth” analysis would just be me writing the stat line you can easily find below. Check out the below graph, reference our ownership and point projections, visit the slack channel, make your best dart throws, and good luck!