Following Denny’s Hamlin comeback win at Bristol, the Cup series gets the week off. This will be the last such break for the rest of the season, playoffs included. Thus, starting next Sunday the Cup Series will be in action until Championship Sunday following Thanksgiving.
Not a member of Awesemo.com? Sign up HERE to gain access to his premium projections, rankings and our Slack Chat!
The Xfinity and Trucks Series press on though but at different venues. The Gander Outdoors Trucks Series makes its lone visit to a road course, and Canada for that matter when it races Sunday at Canadian Tire Motorsport Park. In fact, this is the only time any of the three series will race north of the U.S. border. The Xfinity Series, however, goes to its third road course of the season at Road America. When tossing up the merits of previewing either the Truck or Xfinity race I sided with Xfinity. Not only do more of you have more familiarity with these drivers but the prize pools should be larger. And here at Awesemo we like money.
Road America Preview
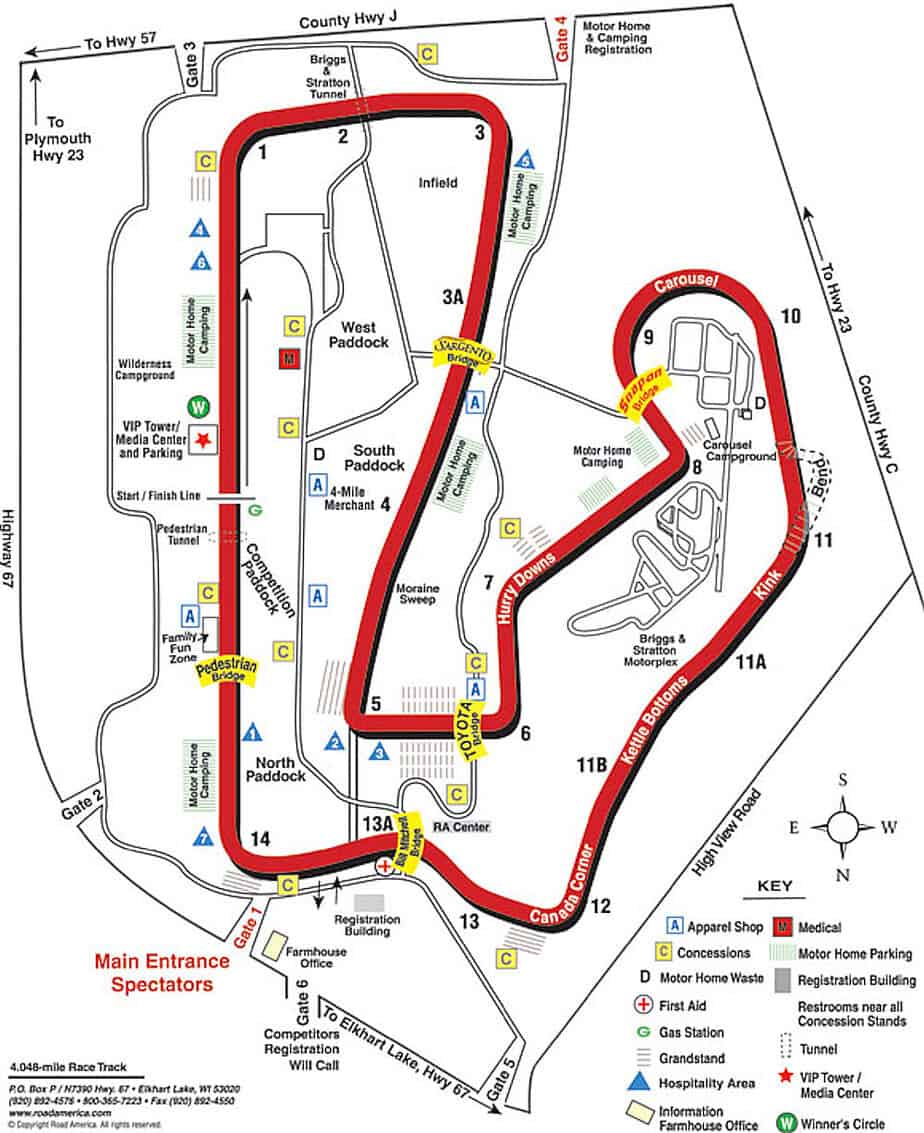 Road America is by far the longest track in all three major series. Measuring out to a whopping 4.048 miles in length, no oval or fellow road course even comes close. While not the most technical course, it features several different aspects that give it plenty of character. These varying features almost give Road America the feel of two tracks combined into one.
The left-hand side of the track resembles Indianapolis with long straightaways. The right-hand side of the track is the bulk of the road course with ten turns including a sharp left-hand turn that goes straight into the carousel.
This all combines for what has been pretty exciting racing in the short window that Xfinity has been racing here. Four times this race has gone to a green-white-checkered finish. This includes a crazy triple green-white-checkered finish attempt in 2011 when Reed Sorenson won. Yeah, that Reed Sorenson. For what it’s worth, the early 2010’s was not a great period in Xfinity racing. The debate for the best driver in that field is legitimately Ricky Stenhouse Jr. or Aric Almirola.
DFS Implications
Considering the length of Road America, it makes sense that the longest track would also have the smallest amount of laps. 45 total laps are on the bill for Saturday afternoon meaning roster construction really needs a fine-toothed comb. Consider this, fastest laps will be fairly random in true road course fashion. Ever since the switch to stages, the top two lap leaders have failed to notch more than 5 fastest laps here.
So, if we can’t count on the 22.5 fastest laps points, what is bankable? Throwing out fastest laps only leaves us with laps led points. However, 45 laps only makes 11.25 laps led points for the taking. A miniscule number so underwhelming it makes me wonder if chasing a lap leader is even worth it? Oh, but wait, it gets “better”.
Ever since stages were introduced to this race (2017), the number of laps led by the top “hog” has dropped. Meanwhile, the total number of lap leaders has jumped too.
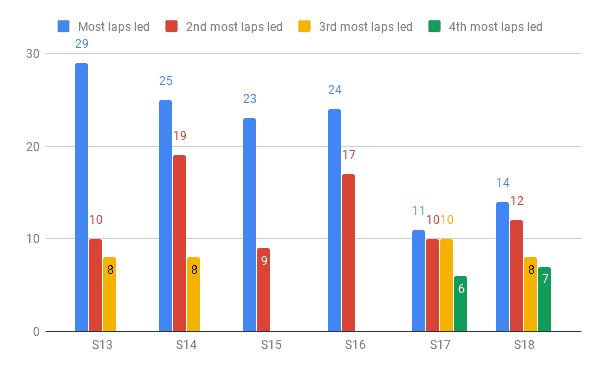
Granted, the “dominator” points were pretty small before stages were introduced. However, now the top lap leader is barely getting any bonus points worth chasing. In the 2017 race, the top “hog” got 5.25 bonus points for his trouble. Last year’s top “hog” scored 5.50 dominator points himself. The point of all of this? Don’t go chasing dominator points this Saturday.
What is Valuable?
If we’re not chasing dominator points then just what are we looking for? Well, it only leaves us with the other two aspects of fantasy NASCAR scoring – place differential and finishing position. Below are the fantasy scores from last year’s Johnsonville 180.
| Player | Salary | Start | Actual Finish | Actual Score | Actual Value |
| Justin Allgaier | 11100 | 11 | 1 | 61.5 | 5.5 |
| Daniel Hemric | 9700 | 12 | 3 | 52.75 | 5.4 |
| Elliott Sadler | 10700 | 17 | 5 | 51 | 4.8 |
| Matt Tifft | 8500 | 1 | 2 | 46.5 | 5.5 |
| Ross Chastain | 7300 | 16 | 7 | 46 | 6.3 |
| Garrett Smithley | 6400 | 31 | 15 | 45 | 7 |
| Katherine Legge | 6000 | 26 | 14 | 42 | 7 |
| Kaz Grala | 9300 | 18 | 11 | 40 | 4.3 |
| Justin Marks | 10200 | 4 | 6 | 39 | 3.8 |
| Michael Annett | 7100 | 19 | 12 | 39 | 5.5 |
| Spencer Boyd | 5400 | 37 | 21 | 39 | 7.2 |
| Alex Labbe | 6600 | 27 | 16 | 39 | 5.9 |
| Cole Custer | 9900 | 2 | 4 | 38.5 | 3.9 |
| Ryan Ellis | 5500 | 28 | 17 | 38 | 6.9 |
| Andy Lally | 7700 | 13 | 10 | 37 | 4.8 |
| Joey Gase | 5200 | 30 | 19 | 36 | 6.9 |
| Chad Finchum | 4600 | 36 | 22 | 36 | 7.8 |
| Brandon Jones | 8100 | 9 | 9 | 35.5 | 4.4 |
| Jeremy Clements | 6900 | 14 | 13 | 32 | 4.6 |
| JD Davison | 8900 | 3 | 8 | 31.75 | 3.6 |
| Vinnie Miller | 5000 | 38 | 27 | 28 | 5.6 |
| Bill Elliott | 7900 | 23 | 20 | 27 | 3.4 |
| Carl Long | 4400 | 40 | 32 | 20 | 4.5 |
| Stephen Leicht | 4700 | 39 | 33 | 17 | 3.6 |
| Ryan Sieg | 6700 | 20 | 26 | 12.25 | 1.8 |
| Scott Heckert | 5300 | 24 | 29 | 10 | 1.9 |
| Josh Bilicki | 5800 | 25 | 30 | 9 | 1.6 |
| Ty Majeski | 7500 | 21 | 28 | 9 | 1.2 |
| Timmy Hill | 4900 | 33 | 35 | 7 | 1.4 |
| Brendan Gaughan | 8700 | 6 | 24 | 6 | 0.7 |
| Tyler Reddick | 9500 | 29 | 34 | 5 | 0.5 |
| Christopher Bell | 11500 | 5 | 23 | 4 | 0.3 |
| David Starr | 5600 | 32 | 36 | 4 | 0.7 |
| Ryan Truex | 9100 | 7 | 25 | 1 | 0.1 |
| Jeff Green | 4500 | 35 | 40 | -1 | |
| Conor Daly | 7400 | 15 | 31 | -3 | |
| Austin Cindric | 9400 | 8 | 37 | -21 | |
| Ryan Reed | 8300 | 10 | 39 | -24 | |
| J.J. Yeley | 5100 | ||||
| Brandon Brown | 6200 | ||||
| David Levine | 4800 |
Coincidentally, Justin Allgaier and Daniel Hemric were two of our top lap leaders. However, those Hog points were so inconsequential they don’t matter in the grand scheme. The bulk of Allgaier and Hemric’s scores was based on finishing position and both picking up nine or more places from start to finish.
Grand Scheme of Roster Construction
That “theme” repeats itself with the rest of the top-ten fantasy scores in all but of two cases. 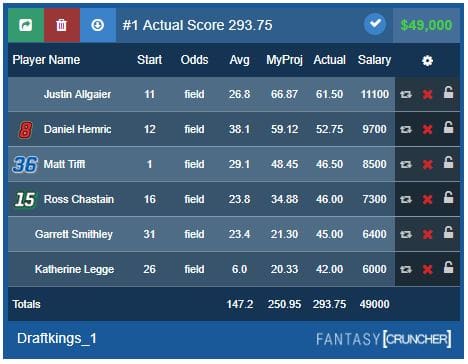 Matt Tifft, the pole sitter, ended the day with the fourth-best score with his second-place finish as well as a few (5.5) hog points. Tifft, in turn, made the optimal lineup based on pure value at $8500. If Tifft had been closer to the $10,000 range, chances are he would have failed to be in the optimal lineup. The other driver with a top-ten score who failed to gain track position was Justin Marks. Justin started 4th, finished 6th, and ended with 39 DraftKings points. However, at $10,200 he was a bad play only reaching 3.9x value for his salary.
So, what just is the grand scheme of building lineups on Saturday? First, act like dominator points are not a thing. If your driver gets them during the course of the race then great. However, scoring those hog points alone should not be your focus at all. If you do chase a Hog, it better be a legitimate contender upfront you can see leading 20+ laps with 5x potential. We’re nowhere close to qualifying, much less practice, and I can bet this will be an Austin Cindric debate for many.
Second, we want to target drivers who can move forward with an emphasis on top-ten real finishes. Those drivers who can do so while gaining 8, 9, or even 10+ positions get priority in our lineups. Finally, lineups get filled out with drivers who can combine a top-20 with hopefully 10 or more place differential. Getting at least 5x value from all of your drivers is going to be a legitimate factor Saturday. Oh yeah, don’t be afraid to leave salary on the table. Checking off those very specific boxes may mean you leave $500 or more left.