On a short week, we leave the high banks of Bristol for the intermediate oval of Texas Motor Speedway. Therefore, let’s jump into the numbers of Texas as we prepare for the O’Reilly Auto Parts 500.
Not a member of Awesemo? No worries, sign up HERE to gain access to the world’s best DFS player’s projections, rankings, tools and premium live blog. Use promo code TWITTER for half off your first week!
A Hot Slick Track in July
One of the interesting things the revamped, COVID-19 affected NASCAR schedule for 2020 has given us is new eyes for old tracks. For the past few years, decades even, we typically see the same tracks at the same time of year. Agreements get made, contracts negotiated, television schedules announced, and the schedule stays fairly consistent from season to season. You can always count on Pocono getting a race in June and Phoenix racing in November.
Part of that racing schedule conundrum has been Texas Motor Speedway. There’s a specific part of the calendar NASCAR didn’t want to give Texas: The summer. If you’ve never witnessed a sporting event outside in the July/August Texas heat and humidity, you’re missing out. Just ask a Texas Rangers fan from the past few decades. Well, actually don’t, they might be sour about getting a new enclosed stadium to remedy this problem and not being able to use it.
Regardless, to avoid this climate-related issue and the impact it would have had on fans, Texas has always been scheduled in the mid-Spring and early fall. Now we get to see what Texas looks like under the blazing sun of a Texas summer. Preliminary forecasts, via Weather Underground, have highs reaching 96 on Sunday. Tack on another 30-40 for surface temperature on the pavement and a further 10-15 for in-car temperatures.

The Texas We Know
Therefore, as the track changes, the style of racing we’ve witnessed should evolve too. Initial success will come down to setup and how well these drivers can adjust to these hot conditions. Thankfully for them and for us, this race is slated to go 500 miles (327 laps). Perhaps even Kyle Busch will have time to adjust his vehicle to where it should be …
So, what do we know about Texas? After the fall 2016 race, Texas repaved its fairly young track. Besides a new layer of asphalt, Texas did a few minor cosmetic adjustments, including decreasing the banking in turn 1 while also widening it. NASCAR detailed the construction work in a slide show, should you wish to see it.
For the past few seasons, judging past Texas data has been a tip-toe through a briar patch because we were weighting pre-repave with post-repave race data. Now, we have at least three years (six races) worth of data with the repaved track giving us a fairly clear picture, especially for driver performance. Remember, this is all tented with the rose-colored glasses of spring and fall climates versus that of July. However, I think we’ll still end up with a broad enough view that we don’t lose the forest for the trees.
Laps Led Data
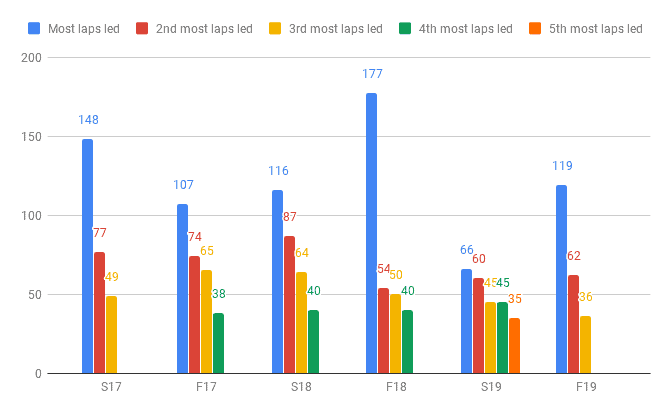
This race has been fairly sticky, at least with the number of laps you expect each dominator to lead. We saw a spike in the fall of 2018 as Kevin Harvick led 177 laps, thus affecting just how many laps the subsequent leaders could actually lead. Next, the spring 2019 race was an oddball thanks to qualifying, and no one led over 66 laps — the lowest mark for the top lap leader at Texas during the Generation 6 era.
Nonetheless, it’s been a safe bet that whoever leads the most laps is going to hit the 100-plus mark. Also, a second driver will lead between 50-100 themselves, although that number has been steadily decreasing as the track wears on. Third and fourth lap leaders are making appearances as well, as should be expected in 327 laps. Yet, their totals are low enough that we approach the discussions of feasibility for NASCAR DFS and whether those dominator points are worth chasing, especially now that salaries on DraftKings have returned to normalcy.
Follow us on all of our social channels! Check out our Twitter, Facebook, Instagram and YouTube for more great Awesemo content.
Lap Leaders
| Starting Position | Final Position | Place differential | Total Laps Led | Fastest Laps | ||
| S17 | 2 | 12 | -10 | 148 | 51 | |
| 1 | 4 | -3 | 77 | 22 | ||
| F17 | 7 | 2 | 5 | 107 | 63 | |
| 11 | 37 | -26 | 74 | 46 | ||
| S18 | 8 | 1 | 7 | 116 | 70 | |
| 2 | 2 | 0 | 87 | 82 | ||
| F18 | 3 | 1 | 2 | 177 | 83 | |
| 8 | 3 | 5 | 54 | 17 | ||
| S19 | 16 | 10 | 6 | 66 | 45 | |
| 1 | 5 | -4 | 60 | 14 | ||
| F19 | 1 | 1 | 0 | 119 | 67 | |
| 6 | 2 | 4 | 62 | 50 |
As our NASCAR DFS rosters will focus on two dominators this Sunday, we look above to where the top two lap leaders have come from. The spring race of 2017 shouldn’t be a surprise to see the front row combine to lead 219 laps. A new track surface combined with cool spring temperatures will always make for a grippy track that suits the drivers with clean air and track position. Since then, we have seen a real jumble of where the lap leaders originate.
What I want to focus on is the races last year. In the 550-horsepower package last season, the pole sitter led the second-most laps in the spring (Jimmie Johnson – 60). That was followed up by Kevin Harvick starting on the pole and leading 119 laps en route to victory in the fall. The validity of the pole sitter will be determined tonight by the random draw. However, even a fairly milquetoast 2019 version of Jimmie Johnson was able to take advantage of clean air.
Rewinding Fall of 2019
For corollary purposes in NASCAR DFS, our best bet for Texas is to look back to the fall race of 2019. As previously stated, Harvick started on the pole, led 119 laps and punched his ticket to Miami for the championship. The surprise of all surprises was Harvick’s SHR teammate, Aric Almirola, leading the second-most laps (62) that day. That race ended with 11 cautions, eight of which were for accidents. That number should necessarily rise Sunday with the increased temperatures.
DraftKings versus FanDuel for NASCAR DFS
When you compare optimal lineups from DraftKings to FanDuel in the fall of ’19, you see striking similarities. Both optimal lineups included Kevin Harvick and Aric Almirola ($7,500 DraftKings, $7,000 FanDuel) who became a value wonder with his 80-plus points on both sites. Daniel Suarez ($7,200 DraftKings, $6,700 FanDuel) became another value add who not only brought home a top-five finish but led 25 laps in the process. Another similarity between DraftKings and FanDuel was Clint Bowyer who went from 24th to 13th and was relatively underpriced ($8,800 DraftKings, $8,500 FanDuel). Yes, a team stack (SHR) finally paid off.
After this is where the sites diverged. The last roster spot on FanDuel was occupied by Joey Logano who went from 11th to fourth, scoring 74.4 points on FanDuel at $13,000. On DraftKings, the last two spots were occupied by Austin Dillon, and his lackluster eight spots gained at $7,000, and Alex Bowman who started fifth, finished fifth and scored just 49.25 DraftKings points at $8,200.
The lineup structures were a bit anomalous thanks to the salaries that those lap leaders came at. Had Almirola been priced up a bit more on either site, then we wouldn’t be looking at such a balanced lineup construction. However, when you strip away salaries and look at strict performances, you see a dual-dominator build on both DraftKings and FanDuel. Furthermore, the inclusion of a third lap leader (Suarez) made both optimal, but that was due to his salary once more.
Related NASCAR DFS Content
- The Awesemo YouTube Channel – Weekly NASCAR DFS Strategy Show
- NASCAR Top Drivers Tool – DFS Dominators on FanDuel and DraftKings (PREMIUM)
- NASCAR DFS Rankings for DraftKings and FanDuel (PREMIUM)
- NASCAR Ownership Projections for DraftKings and FanDuel (PREMIUM)
- NASCAR Projections for DraftKings and FanDuel (PREMIUM)

