Let’s dig into the data from Week 11 as we look ahead to Week 12 NFL DFS picks for the daily fantasy football season and NFL DFS slates on DraftKings and FanDuel. The Week 12 NFL DFS Data Deep Dive looks into the advanced metrics you need to know in order to make informed daily fantasy football decisions. Matt Savoca takes a look behind the curtain of his process, delivering the visualizations and proprietary statistics along with some quick-hitter thoughts that he uses to prepare for his weekly Main Slate Matchups column, published every Thursday, right here on Awesemo.com.
Week 12 Data Deep Dive: DraftKings + FanDuel NFL DFS Picks
Team Efficiency (Click Graph to Enlarge)
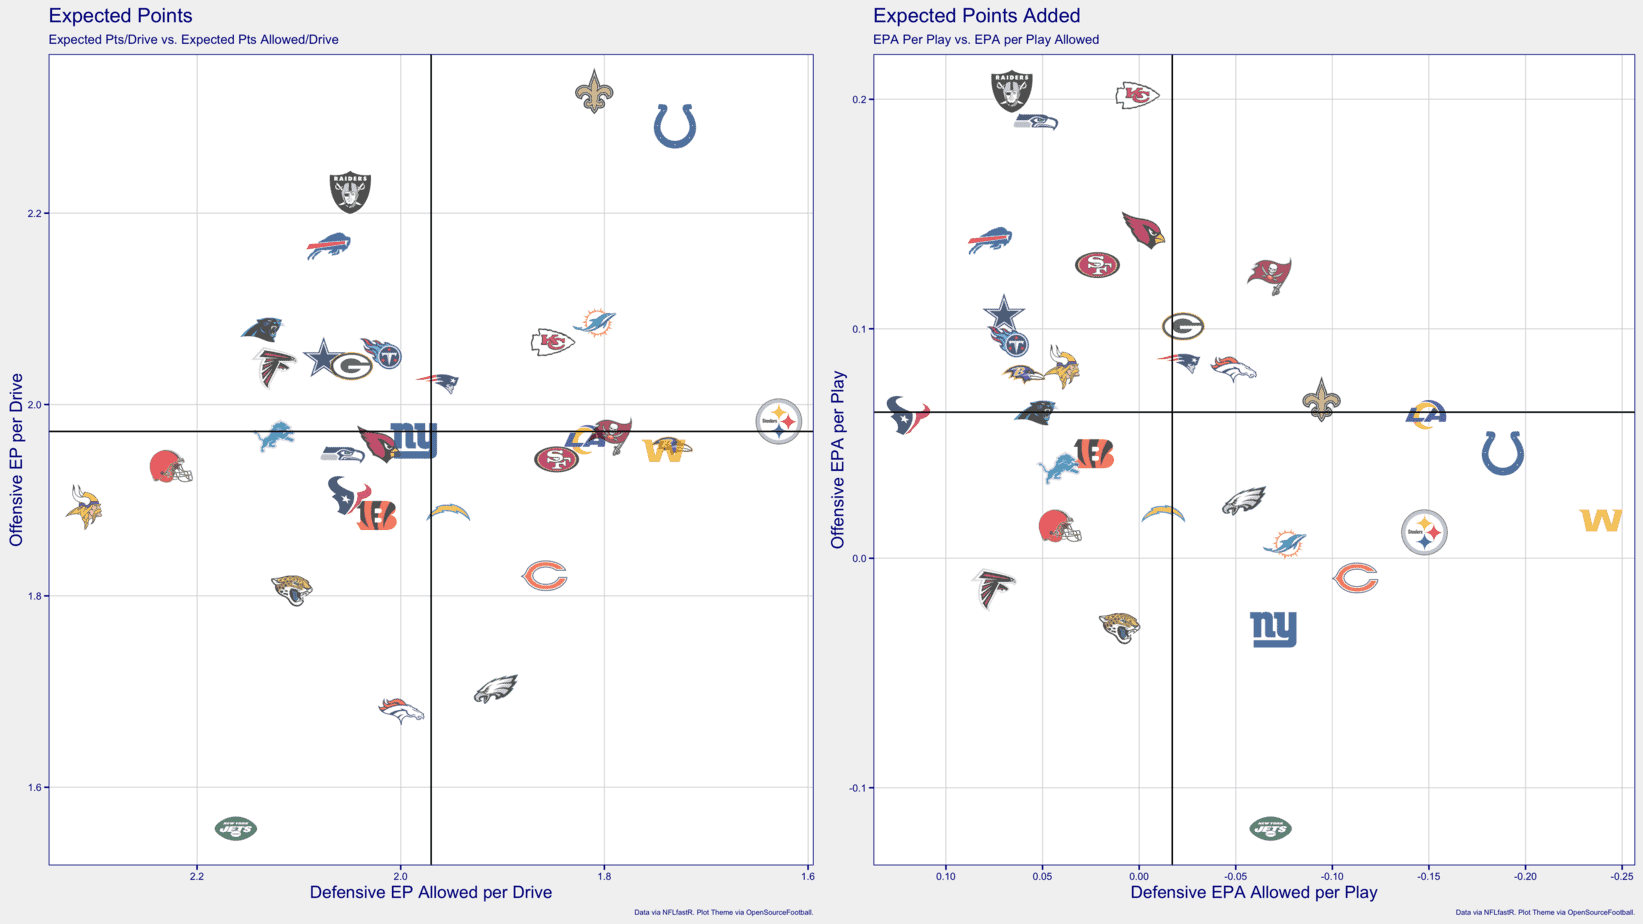
- No one who read this chart would have been all that surprised at the outcome of the matchup between the Packers and Colts in Week 11. The Colts look like arguably the best team in the league in expected points per drive and in expected points allowed per drive. Though their per-play efficiency is lacking on offense, the advanced metrics seem to indicate this team could make a significant playoff run.
- The Steelers defense is in a league of its own in terms of expected points per drive.
- The same could be said about Washington’s defensive per-play efficiency as well.
- The Broncos were surprise winners against the Dolphins on Sunday to most of the public on Sunday, but Denver actually ranked as the better (closer to the upper-right) team in per-play efficiency, the chart on the right, which should have been a strong indicator they would at least be competitive.
Team Aggressiveness (Click Graph to Enlarge)

- The devastating injury to Joe Burrow means the Bengals will likely drift significantly back towards the center of this graph, just as we saw with the Cowboys once Dak Prescott was lost for the season.
- The Vikings welcome Cleveland, who for all intents and purposes is running the same exact offense as Minnesota to the cluster of most run-oriented teams in the NFL. When one has running backs like Nick Chubb, Kareem Hunt and Dalvin Cook, that tends to happen. Still, both teams could likely benefit from more early-down aggressiveness.
- The Chargers, who began the season in the very bottom left of this chart, could wind up being one of the most aggressive, past-oriented teams of the second half. They’re now league average in both true early-down pass rate and air yards per second
- The Jets have just given up. It’s sad, really.
[table id = 1427 /]
Quarterback Efficiency (Click Graph to Enlarge)
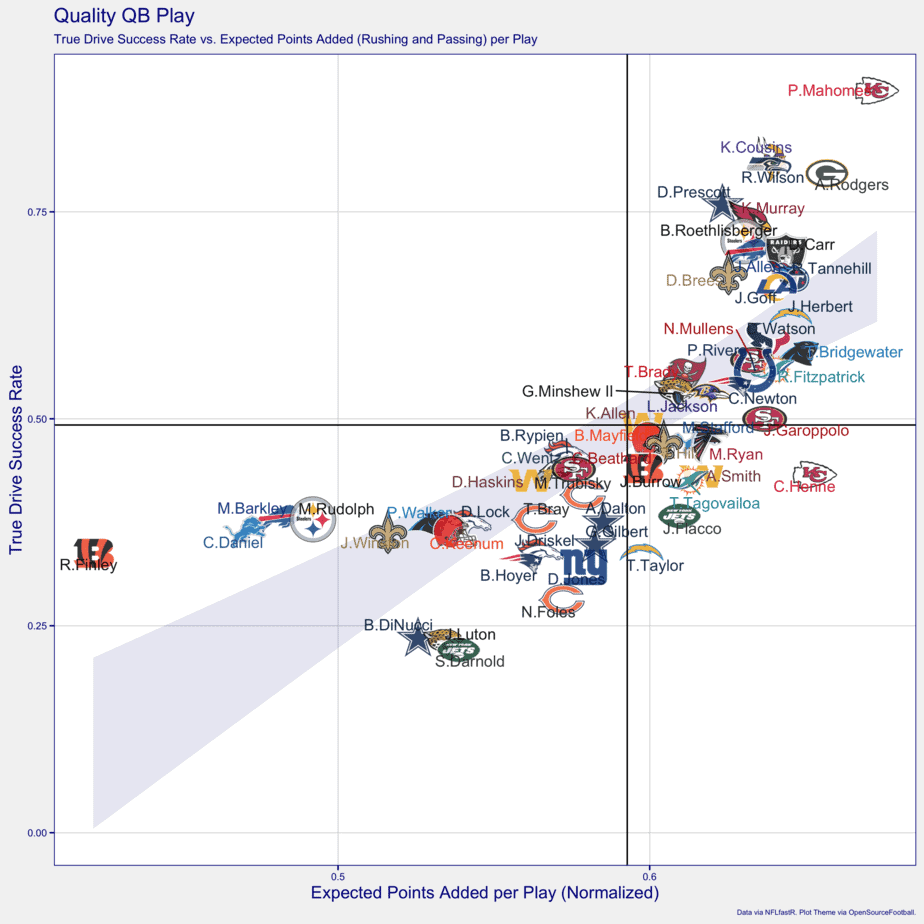
- Patrick Mahomes remains the best in the league. His game winning drive sealed his fate as the runaway top quarterback in the NFL in 2020.
- Though they lost to Dallas this week, Kirk Cousins still isn’t getting enough credit for turning the Vikings season around after a 1-5 start. They still have a huge uphill battle, but even being in playoff contention is a feat, and Cousins’ efficient play has a ton to do with that.
- It’s time to bring back Gardner Minshew, as Jake Luton is now tightly clustered with Ben DiNucci and Sam Darnold. Nick Foles hasn’t been much better, and now he’s dealing with a hip injury that could keep him out of the Bears’ week 12 game.
- Taysom Hill’s first start put him squarely in a starting quarterback cluster. In terms of per-play efficiency and drive success, Hill was on par with a trio of top-three overall picks: Baker Mayfield, Matt Ryan and Burrow.
[table id = 1426 /]
Skill Player Opportunities for NFL DFS Picks + Lineups (Click Graph to Enlarge)
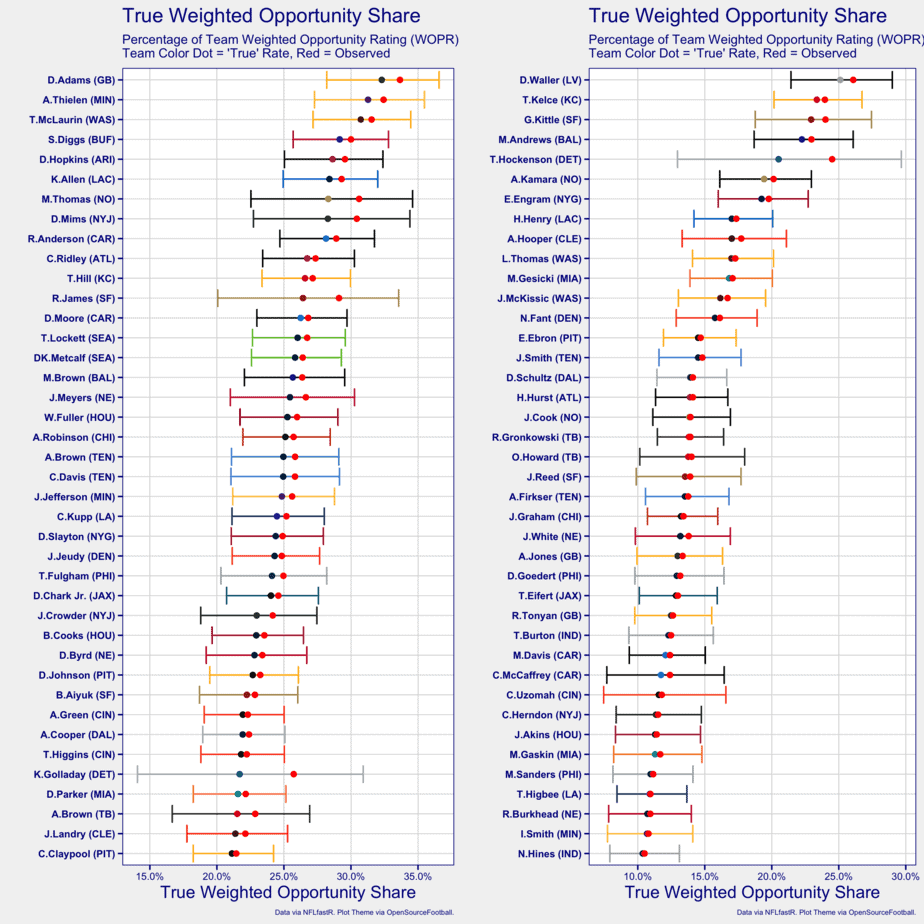
- The wide receiver position has three premiere target hogs in 2020: Davante Adams, Adam Thielen and Terry McLaurin. The trio has separated themselves from the pack, and are the only players “truly” commanding 30% of their team’s opportunities, when adjusted for sample size.
- It’s shocking to see, especially after a series of disappointing seasons, but Corey Davis has truly come into his own as a player this season and now ranks side-by-side with his teammate A.J. Brown in true weighted opportunity share.
- Surprisingly, JuJu Smith-Schuster is now outside the top 40 in this metric, as both Diontae Johnson (30th) and Chase Claypool (39th) have caught Smith-Schuster as the leaders of Pittsburgh’s passing attack.
- Don’t look now, but Michael Thomas may be poised for a late season surge as Week 11 served as a get-right game for last year’s reception leader. Thomas is back to his typical spot in the Top-10 in true weighted opportunity share. He’s still semi-cheap on DraftKings and FanDuel.
- Note the massive drop-off after Evan Engram in the chart on the right. With George Kittle still banged up, there only are six non-wide receivers who are unequivocal every-week starts in fantasy based on volume alone: Engram, Alvin Kamara (who may need to be reevaluated with Hill at the helm), T.J. Hockenson, Mark Andrews, Travis Kelce and Darren Waller.

NFL DFS Picks: High-Value Opportunities (Click Graphs to Enlarge)
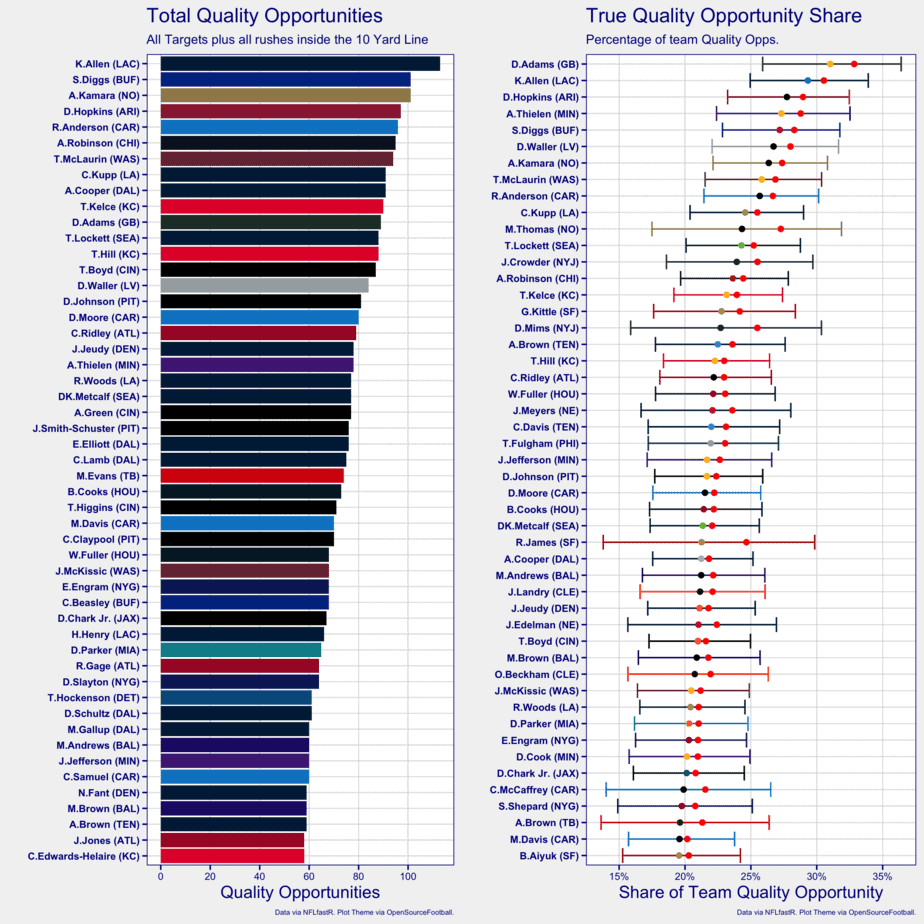
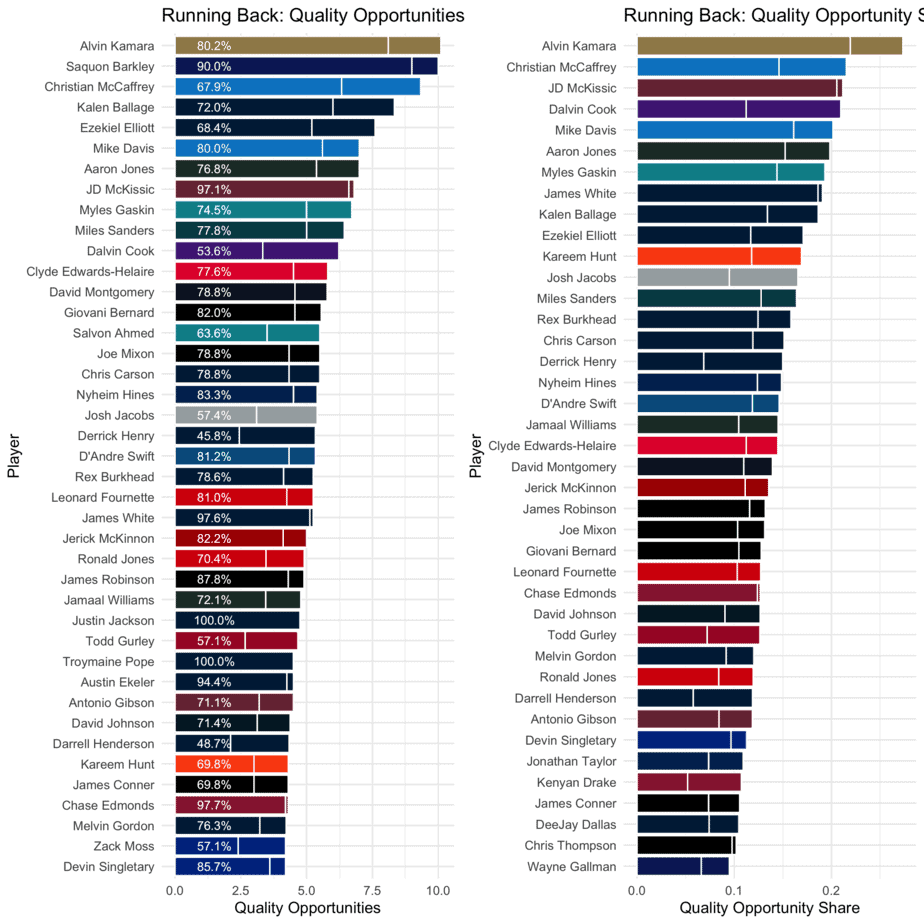
- Kamara’s quality opportunities per game shrank back towards the rest of his position after the first catch-less game of his career last Sunday. It’s clear his usage will need to be monitored with Hill at the helm.
- Despite seeing only four targets in week 11, J.D. McKissic still holds a spot squarely in the top 10 running backs in quality opportunities per game and now ranks third among all running backs in quality opportunity share.
- Miles Sanders continues to disappoint, like the Eagles as a whole, compared to his top-10 share of quality opportunities within the Philadelphia offense.
- Week 12 could mark the return of Austin Ekeler, and his role couldn’t be more defined within the Chargers offense. Both Justin Jackson and Troymaine Pope rank adjacent to Ekeler in quality opportunities per game, indicating they were used as direct backups for Ekeler while the Chargers waited for the bell cow to get healthy. Ekeler has massive potential in the season’s final quarter. He could be a low-owned option in both DraftKings and FanDuel lineups.
[NFL-Content-Links]
Condensed Passing Offenses for NFL DFS Picks + Stacks (Click Graph to Enlarge)
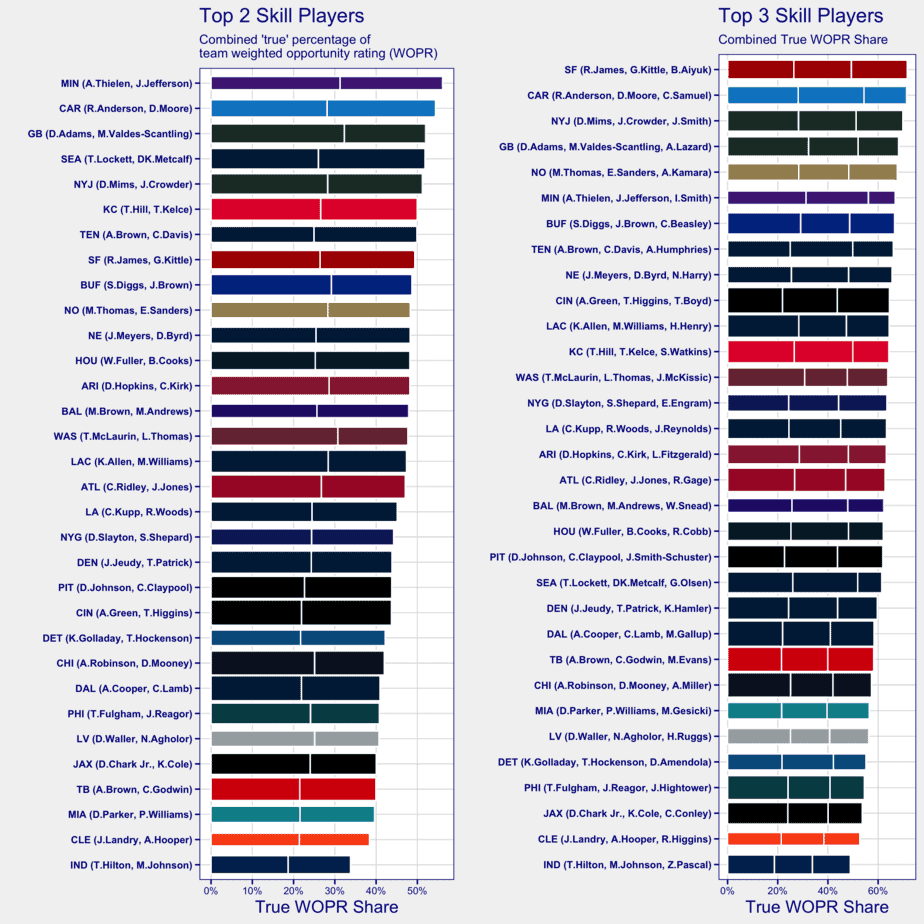
- P.J. Walker’s first start for the Panthers didn’t stop D.J. Moore, Robby Anderson and Curtis Samuel from maintaining their top-two ranking in both the top-duo and top-trio charts. The Panthers remain an elite stacking option on DraftKings and FanDuel in plus-matchups, such as this week against Minnesota, who ranks bottom 10 in expected points allowed per drive and yards allowed per pass attempt.
- It’s time to start talking about A.J. Brown and Corey Davis as one of the elite receiver pairs in the NFL. They now rank seventh in the NFL in the top-duo charts (chart on the left).
- Philip Rivers does not care about your DraftKings and FanDuel fantasy teams. Rivers and the Colts run the least consolidated passing in the NFL by a wide margin.
- Also, did you catch who this chart says is the wide receiver one in Tampa Bay? His initials are A.B.
[table id = 1428 /]
NFL DFS Picks: Bell Cow Backs (Click Graph to Enlarge)
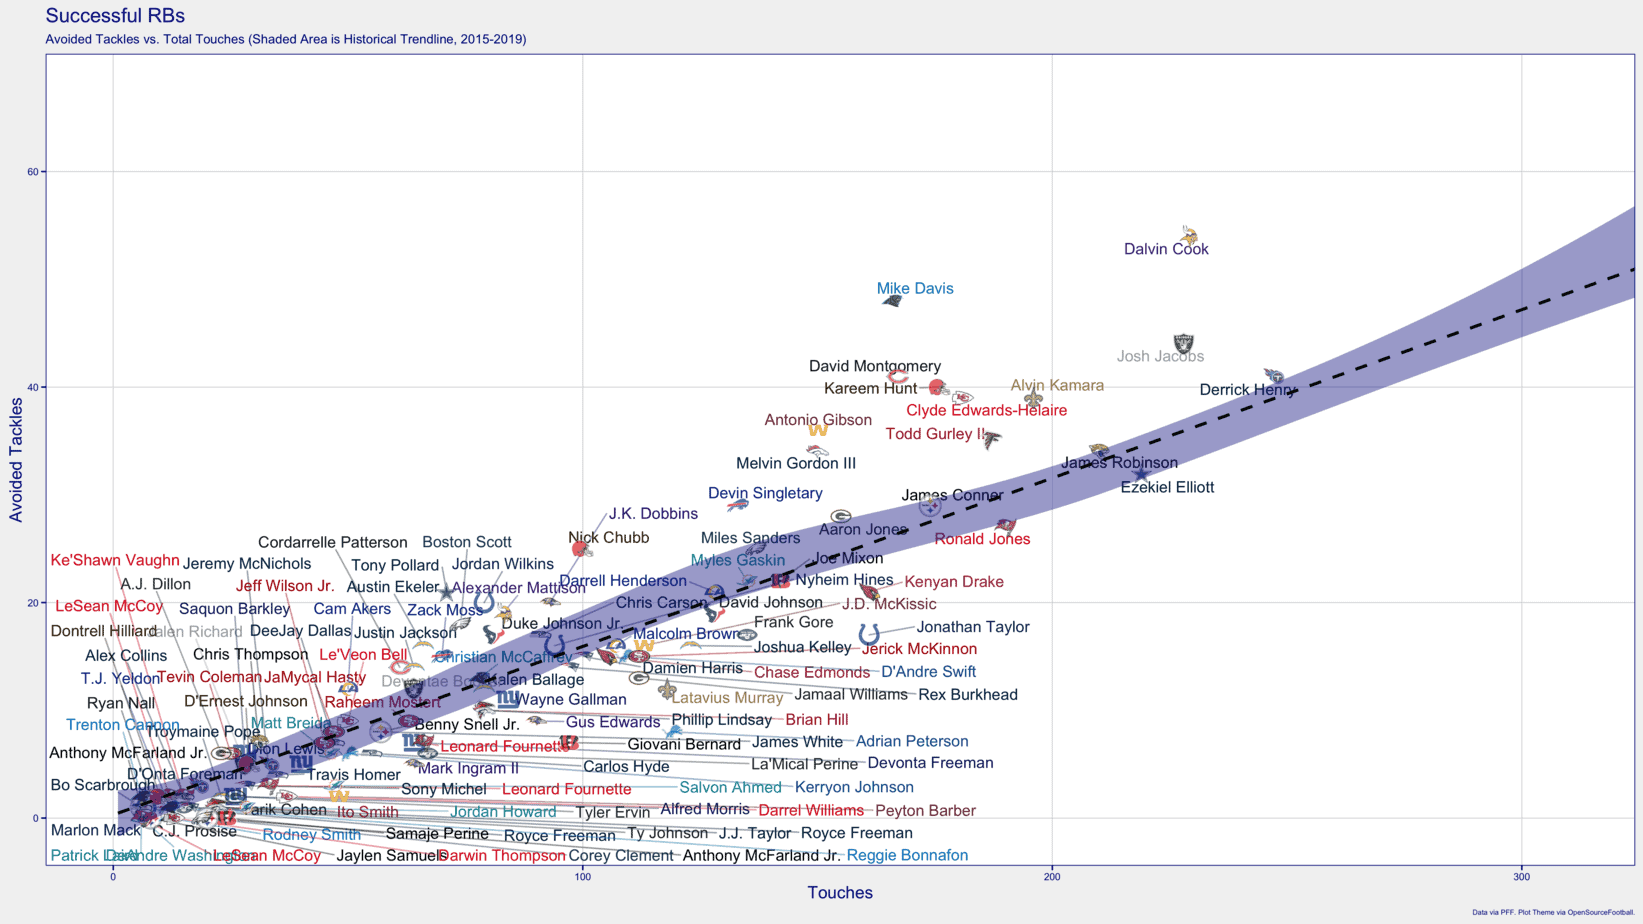
- Put some respect on Kareem Hunt’s name. Even though he was ineffective as a rusher for much of the day, Hunt continues to sit in rarified air as one of the most elusive running backs in football, and he’s not even the starter on his own team anymore. Chubb pops in these metrics as well. He looks as effective as ever after his stint on injured reserve.
- Melvin Gordon’s monster day versus Miami places him well above the historical elusiveness trendline. He could be poised for a huge final month of the season in Denver.
- It’s Derrick Henry’s world; we’re all just living in it. Henry continues to slightly outpace historical expectations despite an absurdly large weekly workload. There’s no one in the NFL like him. Again, he got there on both DraftKings and FanDuel.
- It’s probably time to hang up the cleats for Adrian Peterson. Now with well over 100 touches as a member of the Lions, Peterson is a solid 10-15 avoided tackles below his expected mark — and people played him in cash on DraftKings and FanDuel a week ago.
PFF Grade Net Advantages (Click Graph to Enlarge)
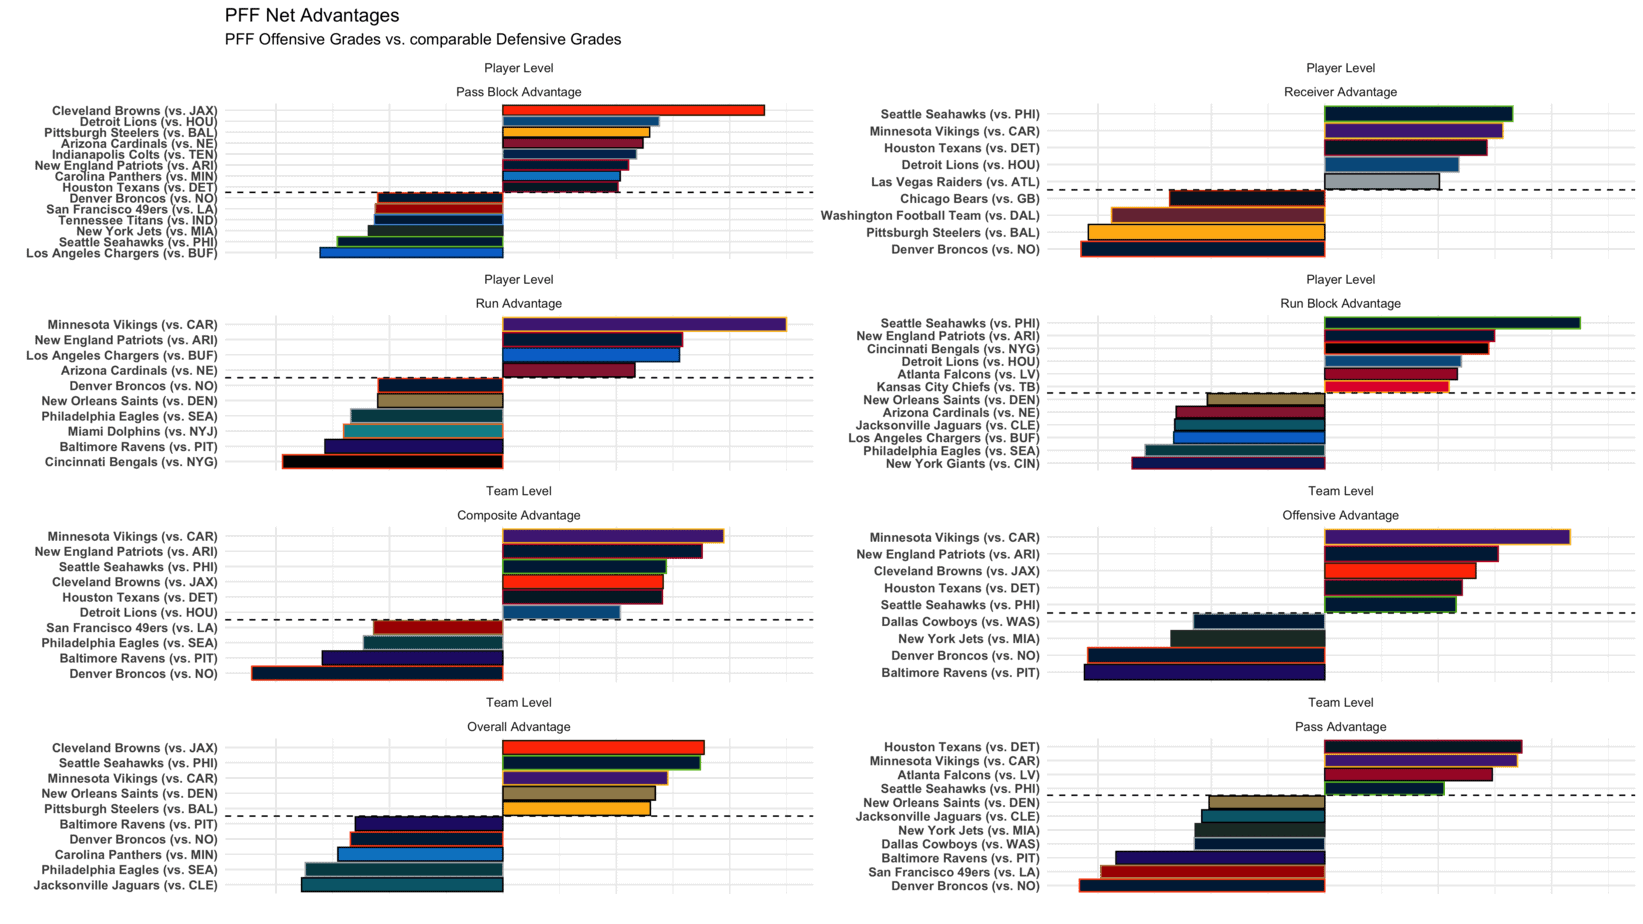
- Another week, another Dalvin Cook likely smash spot on DraftKings and FanDuel. The Vikings appear to pop up as one of the most advantageous offenses in multiple categories, including net run advantage, net offensive grade advantage, net pass advantage and net composite advantage (a weighted combination of all net grades, weighted towards the passing game). A great NFL DFS pick for Week 12.
- Cleveland likely to control the offensive tempo, and they are popping as an advantageous matchup in overall grade advantage, offensive grade advantage and net composite advantage. Don’t be surprised if we see 18-plus looks for both Hunt and Chubb against Jacksonville in Week 12. Fire them both up on DraftKings and FanDuel.
- The Broncos look like they could be in for a tough day against the Saints in Week 12. Their net composite grade is significantly worse than any other team this weekend, indicating their offense may be overmatched in a major way this weekend.
- Could we have a Week 12 Thanksgiving afternoon shootout in Detroit? In a rarity for the Net Advantages Chart, both the Lions’ and Texans’ offenses have an outlier net composite advantage, indicating that scoring could come early and often in the first game of the NFL’s Thanksgiving triple-header. A possible Week 12 stack spot on DraftKings and FanDuel.
[table id = 1429 /]
Follow us on all of our social channels! Check out our Twitter, Facebook, Instagram and YouTube for more great Awesemo content.
Looking for more Week 12 FanDuel and DraftKings NFL DFS picks content? We have loads of Week 12 NFL DFS picks articles, data, DraftKings and FanDuel cheat sheets and more on the Awesemo NFL home page. Just click HERE.