The Week 16 NFL DFS Data Deep Dive looks into the advanced metrics you need to know in order to make informed daily fantasy football decisions. Matt Savoca takes a look behind the curtain of his process, delivering the visualizations and proprietary statistics along with some quick-hitter thoughts that he uses to prepare for his weekly Main Slate Matchups column, published every Thursday right here on Awesemo.com. Let’s dig into the data from Week 15 as we look ahead to Week 16 NFL DFS picks for the daily fantasy football season and NFL DFS slates on DraftKings and FanDuel.
[CARUSO]
[SportsbookAffiliates]
Week 16 Deep Dive: DraftKings + FanDuel NFL DFS Picks
Note: All charts reflect data from the past eight weeks of play. Click graphs to enlarge.
Team Efficiency
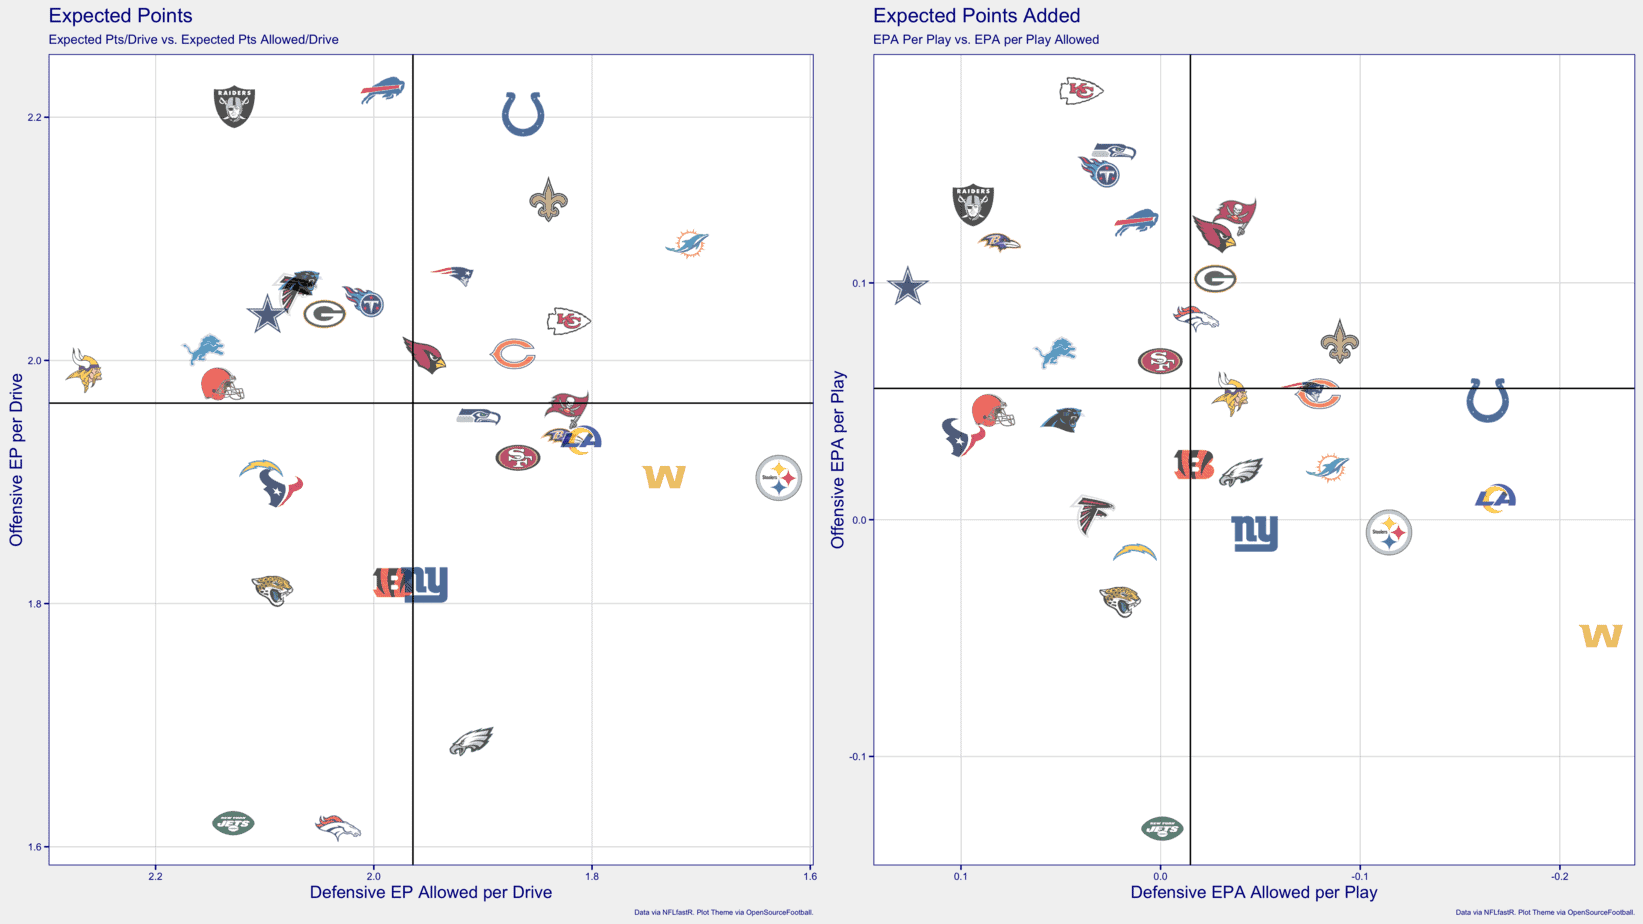
- Despite facing a difficult schedule to end the season, don’t count out Indianapolis from overtaking the Titans in the AFC South. They’ve stood out all season in these metrics and continue to outpace Tennessee despite the Titans holding the division tiebreaker.
- Though their playoff chances are incredibly thin this season, the Raiders look to have figured things out offensively, ranking well above league average in per-drive and per-play efficiency. The same can’t be said about the defensive unit, however, as they rank in the bottom five in both of the charted defensive efficiency metrics.
- Green Bay doesn’t look particularly dominant on either side of the ball, especially considering they’re the No. 1 seed in the NFC. The offense ranks just slightly above league average, while the defensive unit is comparatively lacking, particularly in expected points allowed per drive (the chart on the left).
- Are the Dolphins for real? The expected points chart (on the left) certainly believes they could make some noise in January, as they rank at or near the top of the league in both offensive and defensive expected points per drive over the last eight weeks. Their per-play efficiency, particularly on offense, has room for improvement.
- The Mitchell Trubisky-led Bears are just a game out of the final NFC playoff spot and rank surprisingly high as an offense, particularly in expected points per drive (the chart on the left). Both the offense and defense have been playing at or above league average in both per-drive and per-play efficiency.
Team Aggressiveness
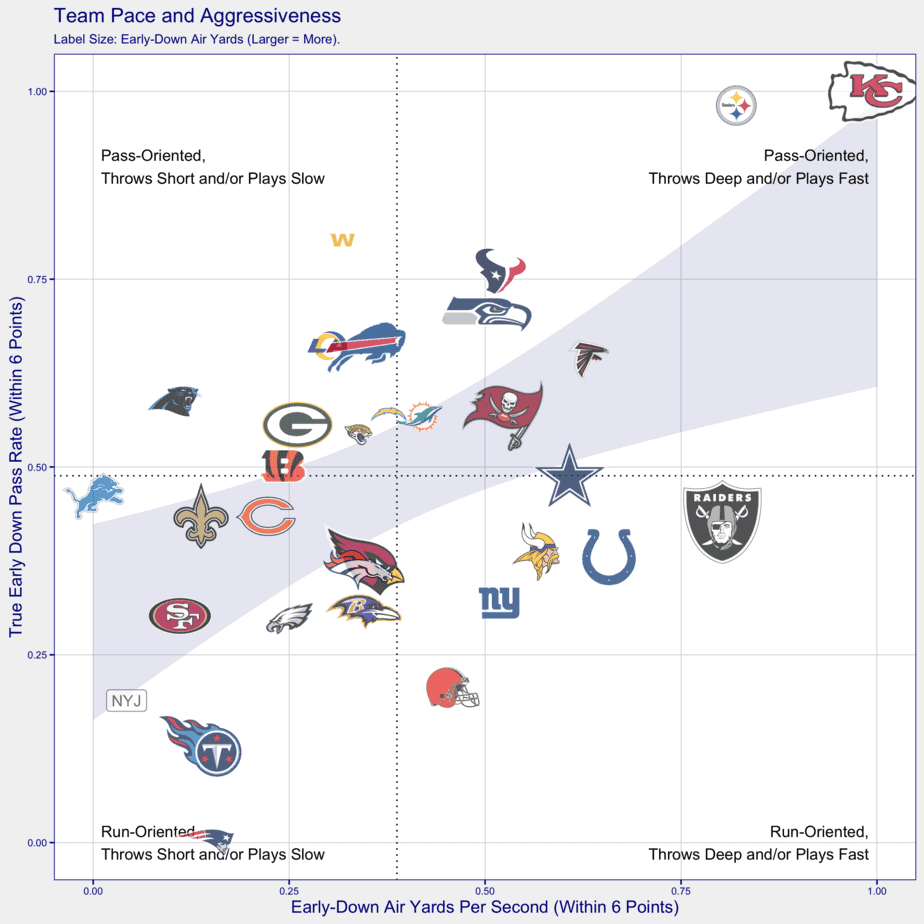
- The Chiefs remain pass-oriented because they have the best quarterback in football in Patrick Mahomes and arguably the two biggest matchup nightmares in the NFL in Travis Kelce and Tyreek Hill. The Steelers remain pass oriented because they cannot run the ball to save their lives. This was exploited by the Cincinnati defense in Week 15, as the Bengals sat back and guarded the pass on nearly every defensive down in their stunning upset of the Steelers.
- The Buccaneers offense seems to be turning the corner just in time for the playoffs. Of the expected 2020 playoff teams, Tampa Bay has arguably the second-most pass-happy offense in the NFC, ranking just shy of Seattle, an offense that’s been significantly more conservative in the second half of the season.
- The Browns understandably refuse to abandon the run as their primary means of moving the ball, particularly in close games, but Baker Mayfield now ranks above league average in early down air yards per second. It’s helped breathe life into his primary receiver, Jarvis Landry, over the last eight weeks.
- It must be December, because the Titans are relying on Derrick Henry even more than earlier this season, a trend we’ve seen each of the last three seasons. The Titans are a much more explosive offense on a per-play basis than New England, but the two teams grade out very similarly in these two charted pace-based metrics.
[table id = 1448 /]
DraftKings + FanDuel NFL DFS Picks: Quarterback Efficiency
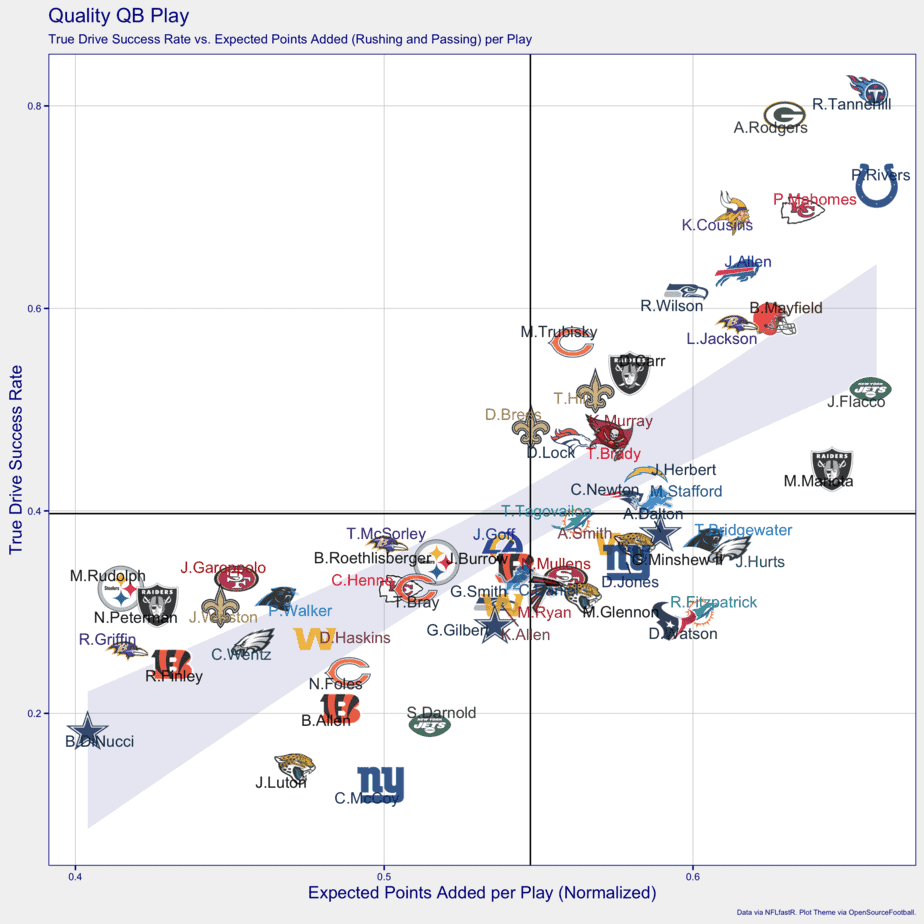
- Despite the Titans ranking as a one of the more conservative teams in the league from a pace and passing perspective, Ryan Tannehill appears to be playing some of the most efficient football of his career. Tannehill, with the help of a top-tier offensive line and surrounded by a cadre of superstar skill-position players, has blossomed into an elite quarterback this season.
- Though the Ravens still have a ton of work to do and need some help from other teams in order to sneak back into the postseason, it’s encouraging to see Lamar Jackson re-ascend toward the top of the quarterback efficiency rankings. Jackson hasn’t finished drives with touchdowns at nearly the same rate as his MVP season, but he still finds himself in the Top 12 in the NFL in per-play and per-drive efficiency.
- Marcus Mariota filled in quite admirably for Derek Carr last Thursday, posting a top-five expected points added per play in Week 15. Mariota appears to be on track to start this weekend and has a chance to prove his strong Week 15 performance wasn’t a fluke, and the Raiders are in a must-win matchup against the surging Dolphins. The only question will be if he’s viable on DraftKings and FanDuel for Week 16.
- In case the Steelers didn’t have enough to be concerned about, Ben Roethlisberger appears to have fallen off a cliff from an efficiency standpoint and ranks among career backups Chad Henne and Tyler Bray in this chart. Pittsburgh is in freefall offensively, and their woes begin with their signal-caller’s ineptitude.
[table id = 1449 /]
DraftKings + FanDuel NFL DFS Picks: Skill Player Opportunities
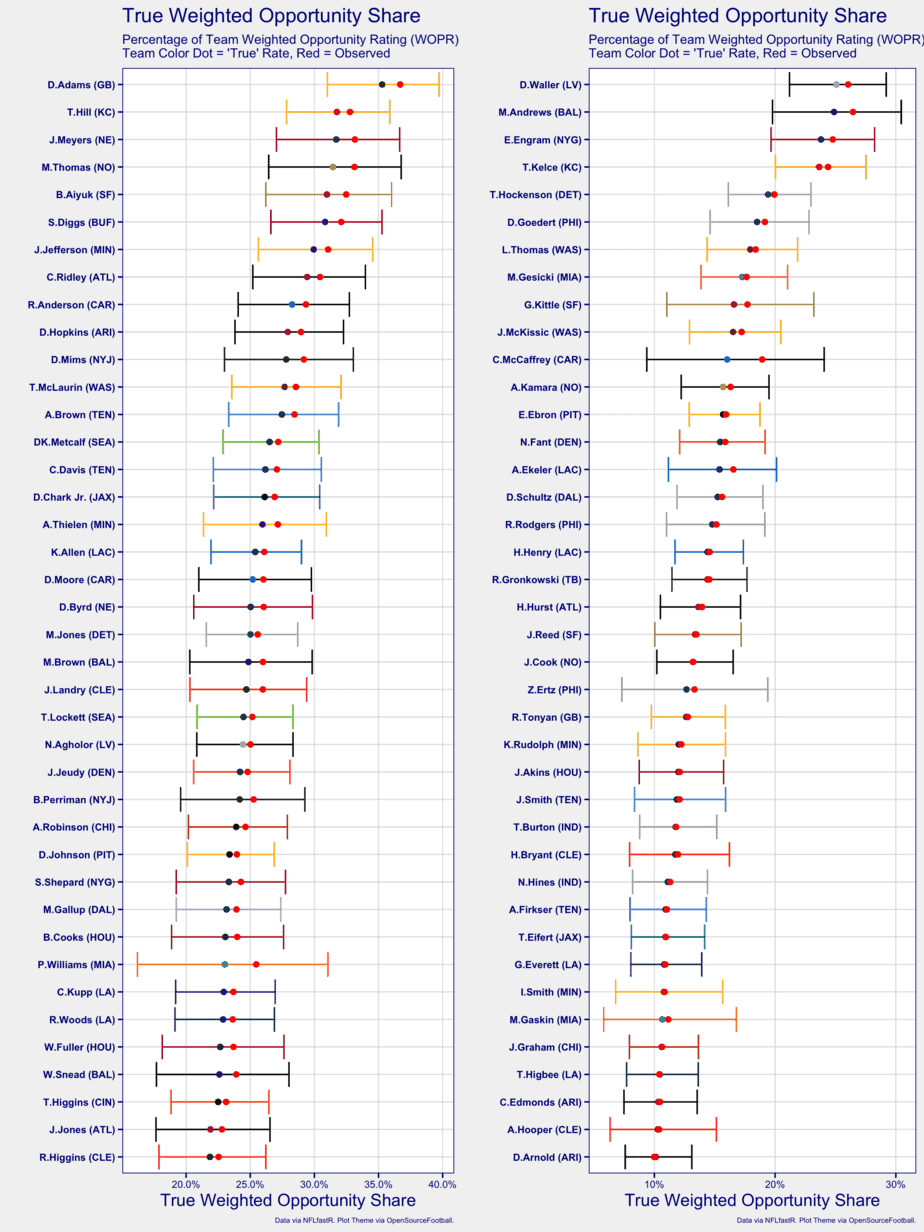
- It’s no longer a question that Davante Adams will finish the season as the most heavily utilized receiver in football when factoring in both air yards and targets. The only question now: How much more will he be utilized compared to every other receiver in the league? If this chart is to believed, Adams commands 5% more of his team’s passing offense than any other player over the past eight weeks.
- It’s time to start talking about Brandon Aiyuk as an elite NFL receiver. From an opportunity standpoint, Aiyuk has certainly taken advantage of a depleted skill-position group in San Francisco. Still, it’s shocking to see Aiyuk already commanding a level of the 49ers offense comparable to Stefon Diggs in Buffalo and DeAndre Hopkins in Arizona.
- You can copy and paste the previous bullet point, only replacing Aiyuk’s name with Justin Jefferson, and every part of the previous statement would remain true.
- Calvin Ridley continues to flourish with extra opportunity during Julio Jones’ (hamstring) extended absence, now ranking seventh among active wideouts in true weighted opportunity share and commanding over 30% of the Falcons’ receiving volume over the past eight weeks.
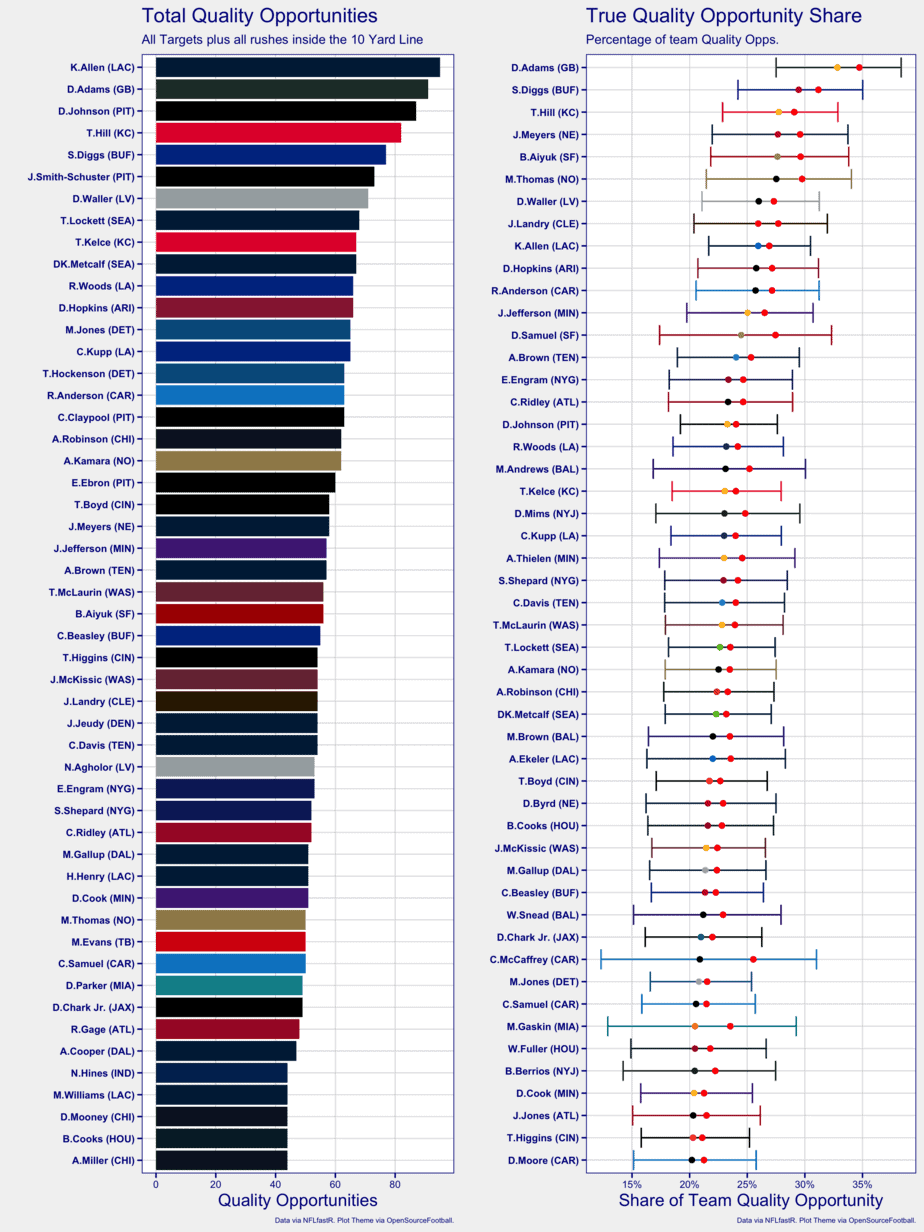
DraftKings + FanDuel NFL DFS Picks: High-Value Opportunities
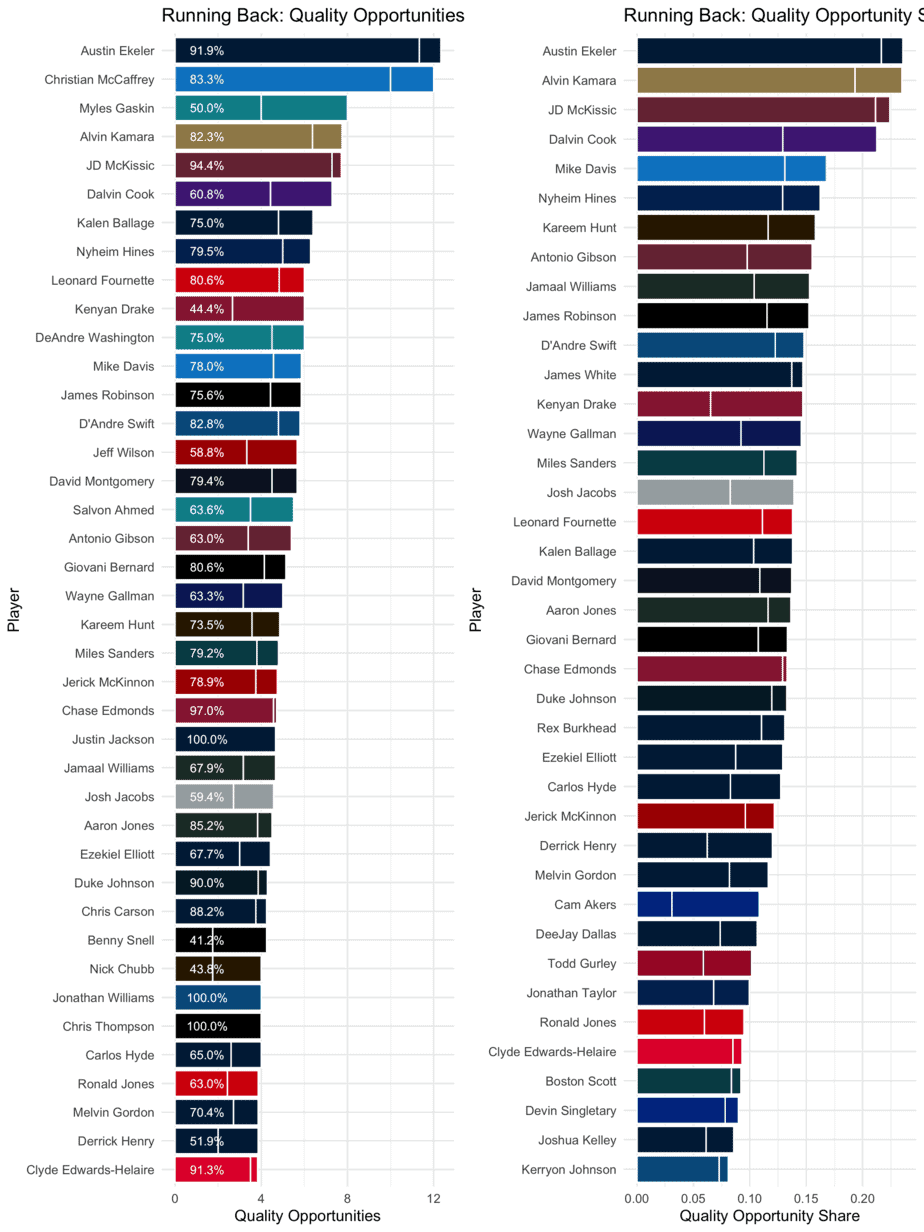
- It’s becoming increasingly clear that Kalen Ballage’s name at the top of the running back chart is anything but a mistake. Ballage appears to have overtaken all other Chargers’ running backs, including Austin Ekeler, as the preferred goal line runner in Los Angeles. Quarterback Justin Herbert’s been effective in goal-to-go situations as a rusher as well. Both Herbert and Ballage are factoring into Ekeler’s weekly volatility as a DraftKings and FanDuel contributor down the stretch.
- J.D. McKissic continues to be a unique reception-friendly running back, ideal for full PPR leagues and platforms (such as DraftKings). McKissic continues to rank in the top five in the NFL in both quality opportunities per game (running back chart on the left) and share of team quality opportunities (the chart on the right).
- Terry McLaurin has been less effective in the second half of the season but continues to be utilized like an elite receiver. McLaurin ranks 12th among wideouts in true weighted opportunity share.
Condensed Passing Offenses
- It’s important to note just how large the Chiefs’ bar is compared to the rest of the NFL. The Chiefs have by far the most fantasy-friendly offense from a pass-volume perspective and have continued to focus on keeping both Kelce and Hill consistently involved. The trio of Mahomes, Kelce and Hill will likely have a top-stack probability more than double any other team once again for DraftKings and FanDuel in Week 16.
- With the Bills’ offense surging down the stretch, fantasy gamers continue to sleep on Cole Beasley as an incredibly valuable weapon on one of the most explosive offenses in the league. Especially with Diggs ailing from a late-game foot injury (that doesn’t appear too serious at this point in the week), Beasley could be posed for some huge performances to end the 2020 regular season.
- With Deebo Samuel out for the 49ers, San Francisco opted to start Richie James across from Aiyuk. Though Aiyuk has already began to prove himself as an alpha receiver, James appears to be playing ahead of Kendrick Bourne and has already had a game with a dozen targets this season. James could be an interesting tournament option in the Saturday slate this weekend in DraftKings and FanDuel lineups.
- Speaking of the Week 16 Saturday DraftKings and FanDuel slate, playing a Marcus Mariota/Darren Waller/Nelson Agholor stack against the Dolphins doesn’t seem like an outlandish idea for fantasy gamers. Waller and Agholor rank well above league average in combined weighted opportunity share.
[table id = 1450 /]
DraftKings + FanDuel NFL DFS Picks: Bell Cow Backs
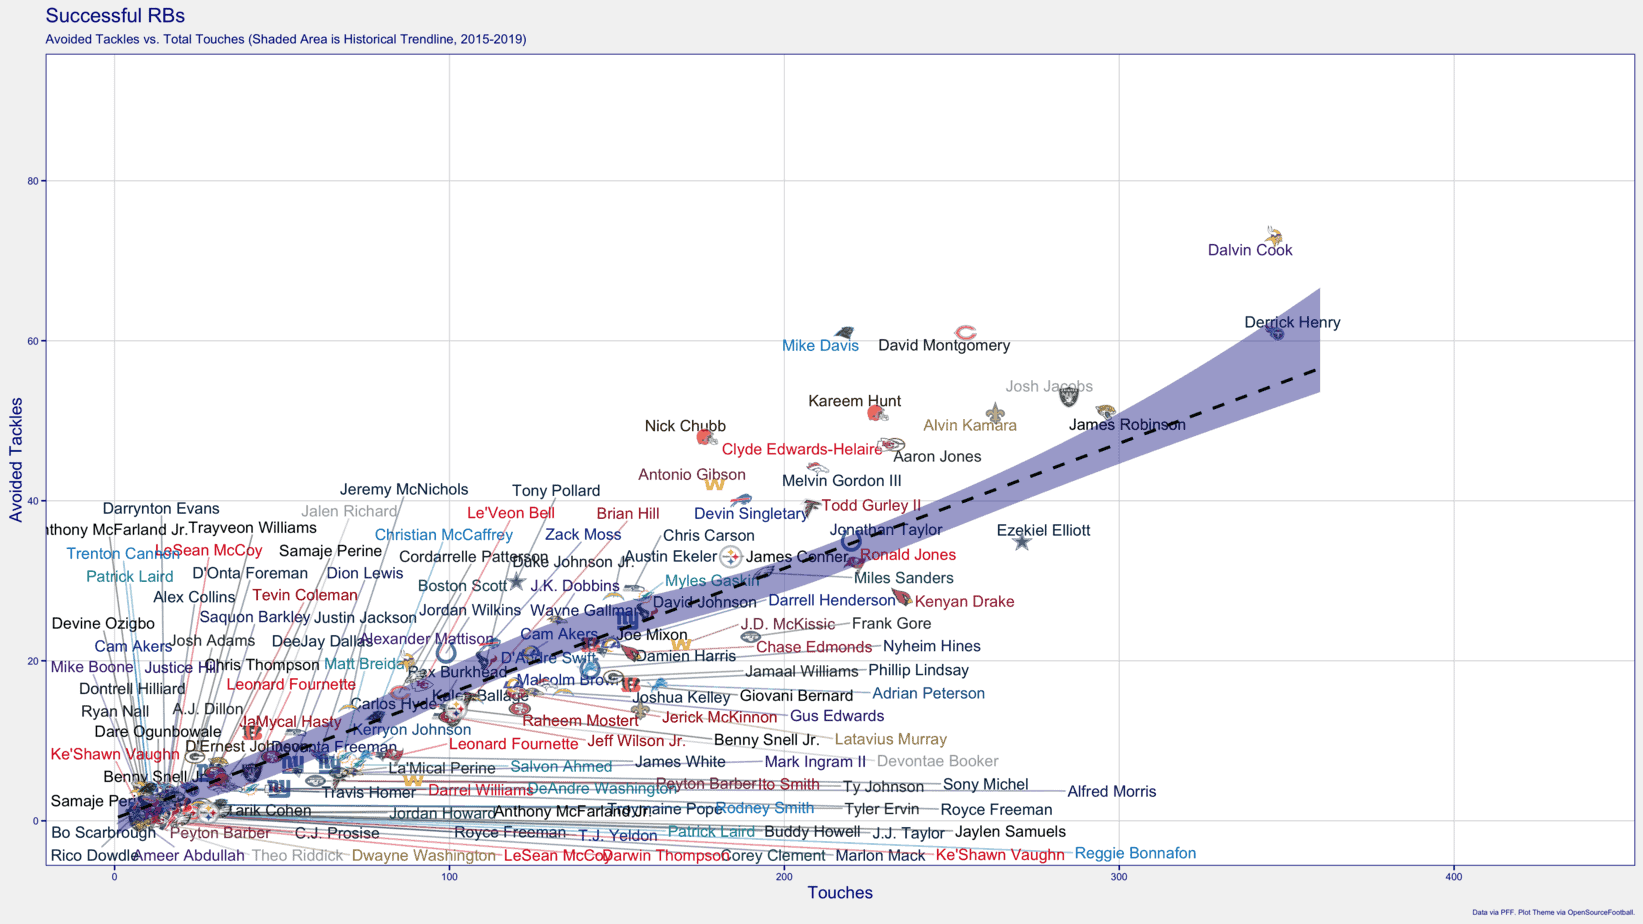
- It’s absolutely egregious that James Robinson wasn’t selected to the Pro Bowl. Robinson, an undrafted free agent, has excelled in all phases despite dealing with constant quarterback changes and game-flow headwinds. He should not have been able to produce the way he has on the anemic Jaguars offense, and yet he’s top eight in scrimmage yards, rushing yards and elusiveness of historical expectation (this chart). Robinson is absolutely a Top-10 running back.
- The numbers haven’t been gaudy, but Clyde Edwards-Helaire put together a fantastic rookie regular season that’s been unfortunately cut short due to hip and ankle injuries sustained in Sunday’s win over New Orleans. Edwards-Helaire is clumped with high-end backs Kareem Hunt and Aaron Jones in elusiveness over expectation and looks to have a bright future ahead of him as the lead back in Kansas City.
- Tony Pollard is better than Ezekiel Elliott. Elliott has performed well below historical expectation based on his workload all season, and Pollard has done nothing except excel on the touches he’s been given. Elliott should be shut down for the season. Hopefully, at full strength in 2021, Elliott can re-ascend to the top tier of running backs once again.
- Not that any running back’s 100% healthy this time of year, but the Panthers’ Mike Davis is clearly not fully healthy and only played on 54% of snaps in the Panthers’ Week 15 loss to Green Bay. Davis has been excellent this season from an elusiveness standpoint but appears to be running out of steam down the stretch. There’s a strong possibility Christian McCaffrey will be back in the lineup for Carolina this weekend.
PFF Grade Net Advantages
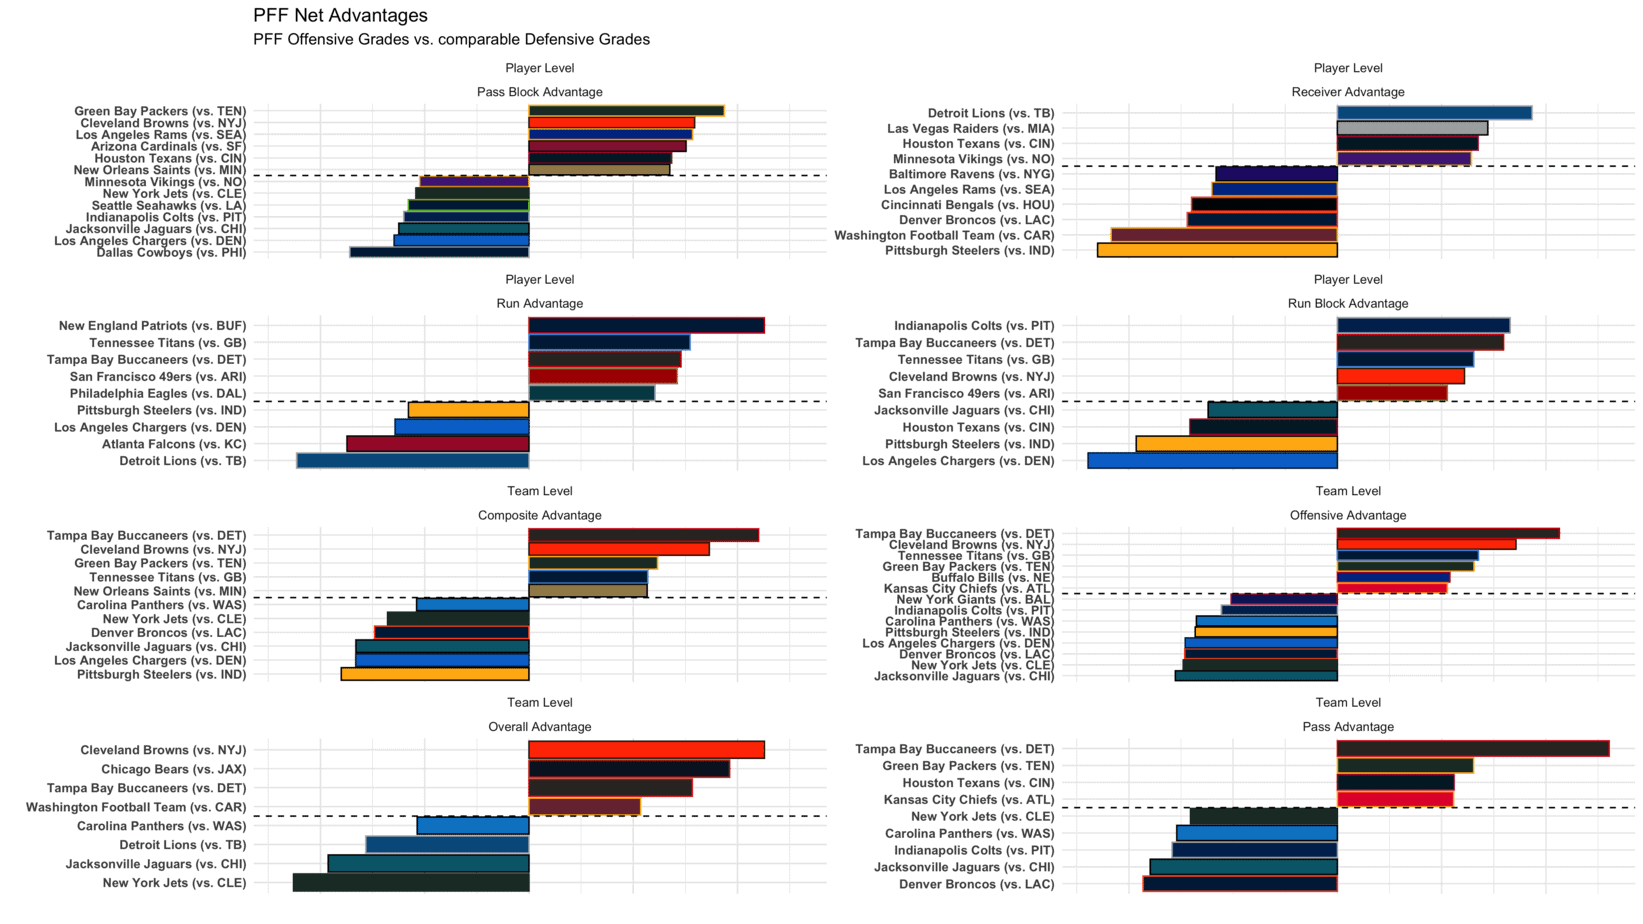
- It looks like a Week 16 is a great week to bet on the Eagles’ Miles Sanders against the Cowboys’ atrocious rush defense. Philadelphia has the strongest net rush advantage of any team on the main slate this weekend.
- Though the Rams reminded us that anything’s possible in a one-game sample, expect the Browns to absolutely trounce the Jets, relying primarily on their two star running backs, Nick Chubb and Kareem Hunt. The Browns rank Top 2 on the slate in net pass block advantage and net run block advantage.
- The Bengals’ defense was able to shut down the Steelers’ woeful passing attack, but Cincinnati’s Week 16 opponent, the Texans, appears to have a major advantage in the passing game, ranking towards the top of the league this weekend in net pass block advantage, net receiver advantage and net overall grade advantage.
- The matchup for McCaffrey far from ideal, as the Panthers rank in the bottom six teams on the main slate in net overall advantage, net composite advantage, and net pass advantage. That said, if he plays this Sunday, don’t be afraid to play him as much as humanly possible in DraftKings and FanDuel lineups. The potential volume is simply too great to pass up, even in a tough Week 16 matchup.
[table id = 1451 /]
[NFL-Content-Links]
Follow us on all of our social channels! Check out our Twitter, Facebook, Instagram and YouTube for more great Awesemo content.
Looking for more Week 16 FanDuel and DraftKings NFL DFS picks content? We have loads of Week 16 NFL DFS picks articles, data, DraftKings and FanDuel cheat sheets and more on the Awesemo NFL home page. Just click HERE.