The NFL Data Deep Dive goes beyond the box score, looking into the advanced metrics you need to know in order to make informed fantasy football decisions. After games wrap each week, Matt Savoca shows a look behind the curtain to his process, delivering the visualizations and proprietary statistics along with some quick-hitter thoughts that he uses to prepare for his weekly Main Slate Matchups column, published every Thursday, right here on Awesemo.com. Let’s dig into the data from Week 5 as we look ahead to Week 6 of the fantasy football season and NFL DFS slates.
For a full list of all our NFL DFS and fantasy football content this season, check out the NFL content schedule.
And don’t forget to join Matt Savoca and Dave Loughran, every Thursday morning at 11 ET on the Awesemo YouTube channel.
Team Efficiency (Click Graph to Enlarge)
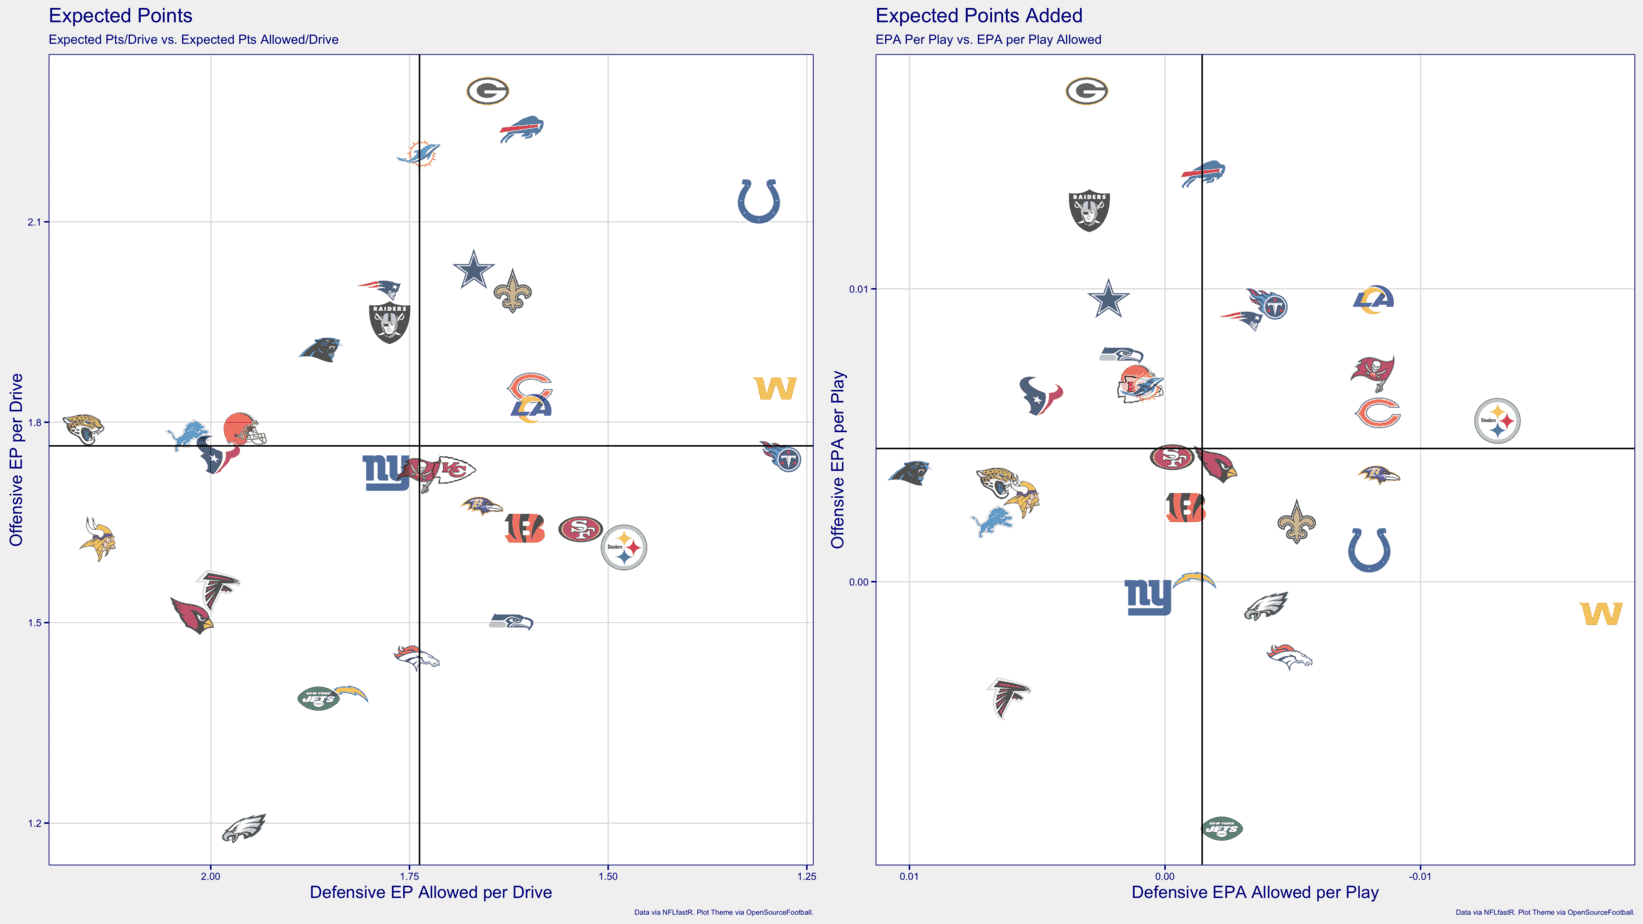
- The Colts are underperforming relative to expectation. Part of this is the inefficient play of the offense. They rank in the bottom third of the league in offensive expected points added per play.
- Cardinals continue to outplay their expectation. Playing the Jets will do that, though.
- Steelers entering the upper echelon of teams in terms of per-play offensive efficiency. The defense is elite.
- The Rams are allowed to run all they want, and play as slow as they want, if they’re going to be this efficient.
- The Packers are rested and for real, but don’t sleep on the Bears. Both teams have elite defenses on a per-play basis.
- The Eagles offense is actually outplaying its per-drive expectation — which is good, since it is worst in the NFL.
- The 49ers are regressing significantly year over year on both sides of the ball.
Team Aggressiveness (Click Graph to Enlarge)
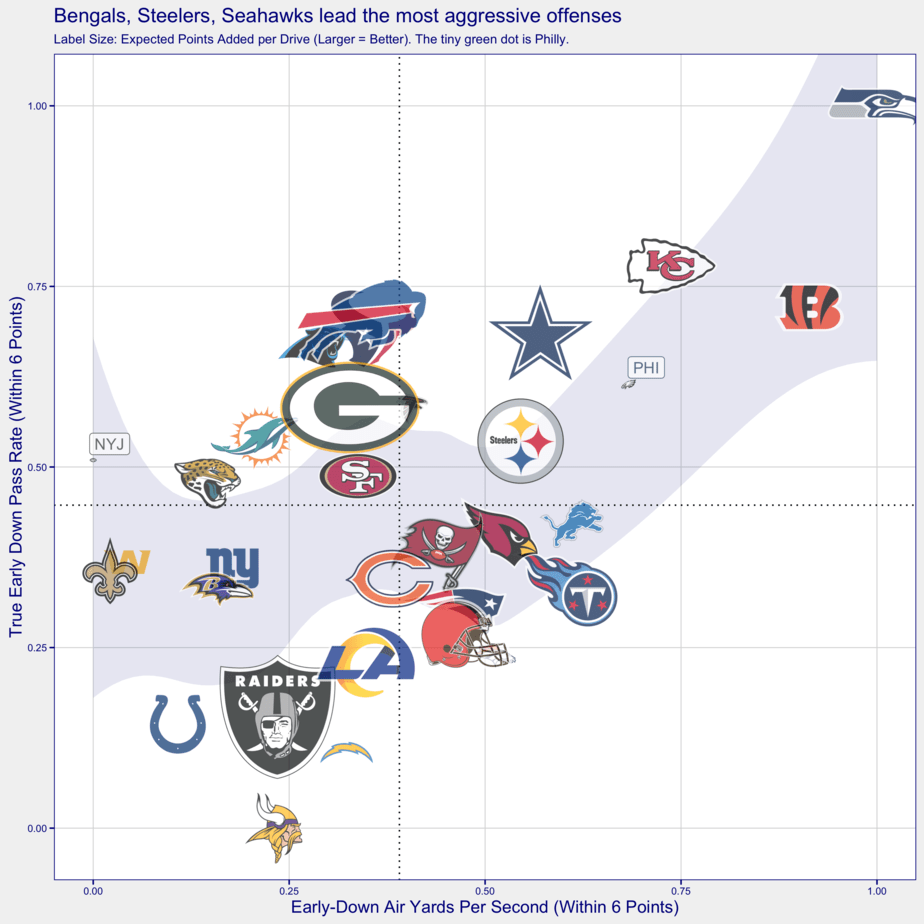
- Russell Wilson is running the coolest offense in the league. Numbers are slightly skewed by late-game numbers, i.e. Wilson’s game winning drive win Week 5.
- Joe Burrow and the Bengals are, literally, Chiefs-level aggressive. The outlook looks strong for both Tyler Boyd and Tee Higgins, both this season and long-term.
- The season-ending injury to Dak Prescott shouldn’t affect the Cowboys’ aggressiveness all that much, but it could certainly affect the efficiency of play.
- Philadelphia is doing the least with the most this season. They’re hideously inefficient but remain one of the least conservative teams in the league. The injuries to wideouts, along with Zach Ertz‘s inability to separate as he has in previous years, have clearly taken their toll.
- The Raiders are certainly picking their moments to be aggressive, but the splits with Henry Ruggs on and off the field are encouraging.
- The Vikings now the least pass-happy team in the league. Kirk Cousins is relatively efficient, but touchdowns are needed by fantasy players on this offense to have big days.
- The Rams are more pass-happy than they were to begin the season.
[table id = 1401 /]
Quarterback Efficiency (Click Graph to Enlarge)
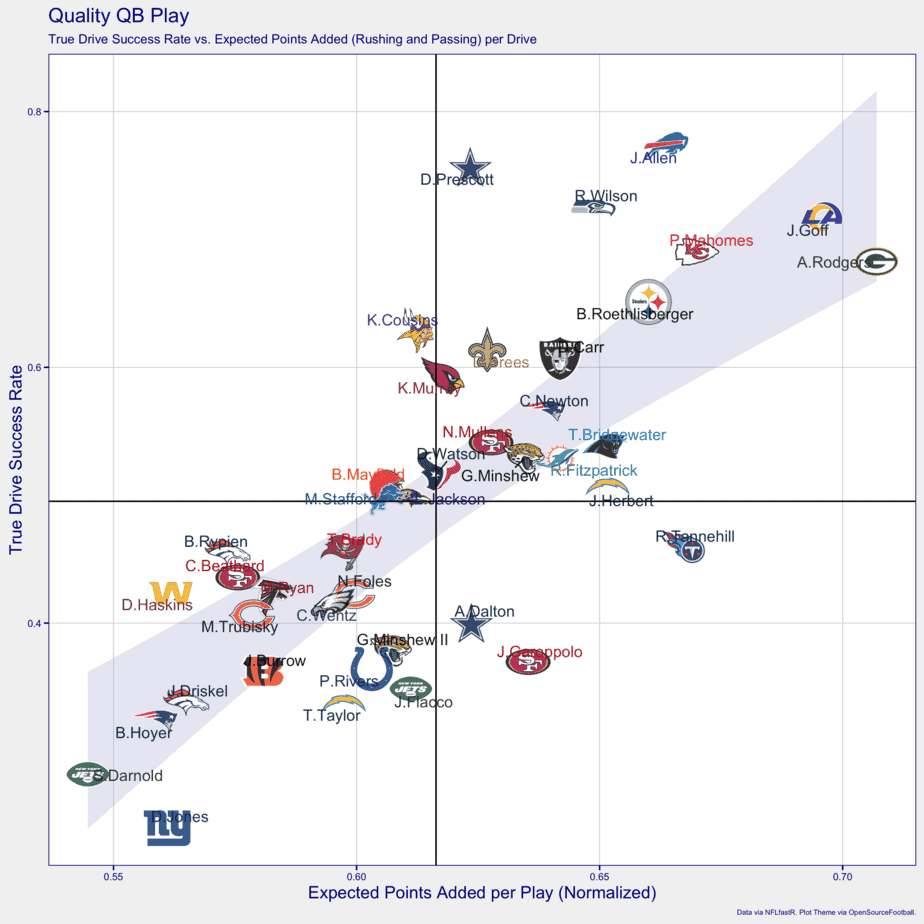
- Jared Goff and Sean McVay are at it again, though numbers look particularly good after two weeks of playing against the Giants and Washington.
- Aaron Rodgers or Russell Wilson would be the MVP if the season ended today
- Patrick Mahomes is still playing at a high level despite the relatively inefficient play of the Chiefs over the last few weeks.
- Ben Roethlisberger‘s making a case for Comeback Player of the Year
- Prescott’s injury stings so much because he had rounded the corner into elite status. He was playing like a quarterback who gets paid Mahomes/Deshaun Watson-level money, just like he was asking for. I can’t think of an athlete I’m rooting for more in 2021 than Prescott.
- Jimmy Garoppolo was a mess on Sunday, but has still been relatively efficient on a per-play basis overall. I don’t think the team is lying when they’re saying the ankle injury continues to be a major factor in sitting Garoppolo.
- Tom Brady is struggling. The names he’s surrounded by (Nick Foles, Carson Wentz, Matt Ryan, C.J. Beathard, Matthew Stafford) on this chart are disheartening.
- Joe Flacco outplayed Sam Darnold in a one-game sample, but not by much. They’re only outdone, in terms of team inefficiency, by Daniel Jones and the Giants.
[table id = 1403 /]
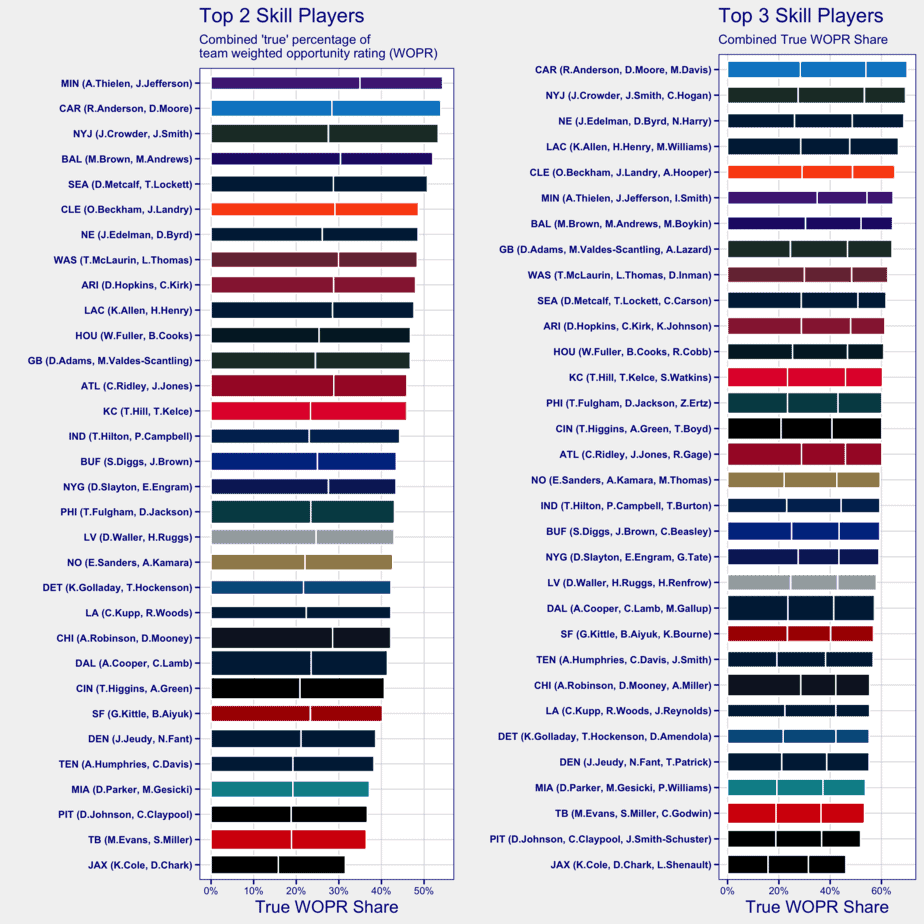
Skill-Player Opportunities for NFL DFS (Click Graph to Enlarge)
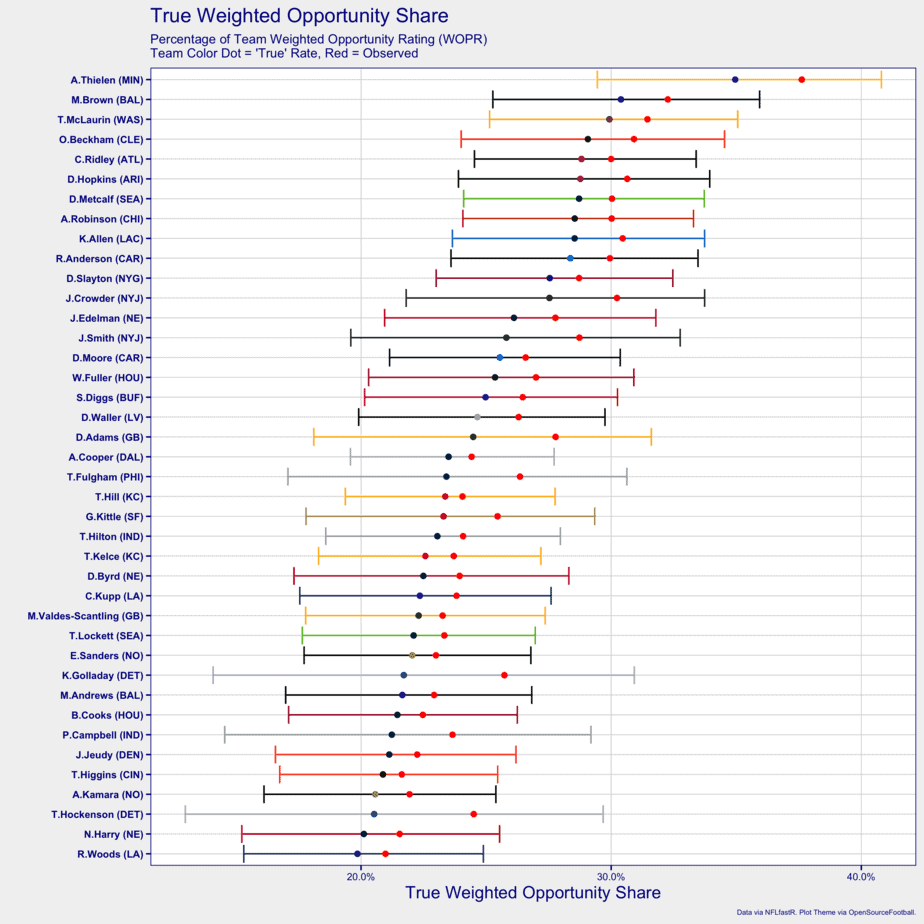
- Marquise Brown is now No. 2 in this metric. He finally found the end zone against the Bengals in Week 5.
- Terry McLaurin had a quiet afternoon, getting targets from Kyle Allen and Alex Smith, but he is one of the most heavily involved receivers in the league.
- Odell Beckham‘s back in familiar territory, earning over 30% of Cleveland’s weighted opportunity.
- D.K. Metcalf has begun to outpace Tyler Lockett in weighted opportunities. He’s received more of the Seahawks offense than Lockett two weeks in a row.
- Keenan Allen maintains his elite usage while on the field. He left Week 5 in the first half with a back injury.
- Jeff Smith (Jets) and Travis Fulgham (Eagles) may both be valuable for the rest of the season.
- Darren Waller remains the top tight end on the chart, but George Kittle is creeping closer. The only other tight ends are Travis Kelce, Mark Andrews and T.J. Hockenson.
- Alvin Kamara is the only running back on the top-40 list.
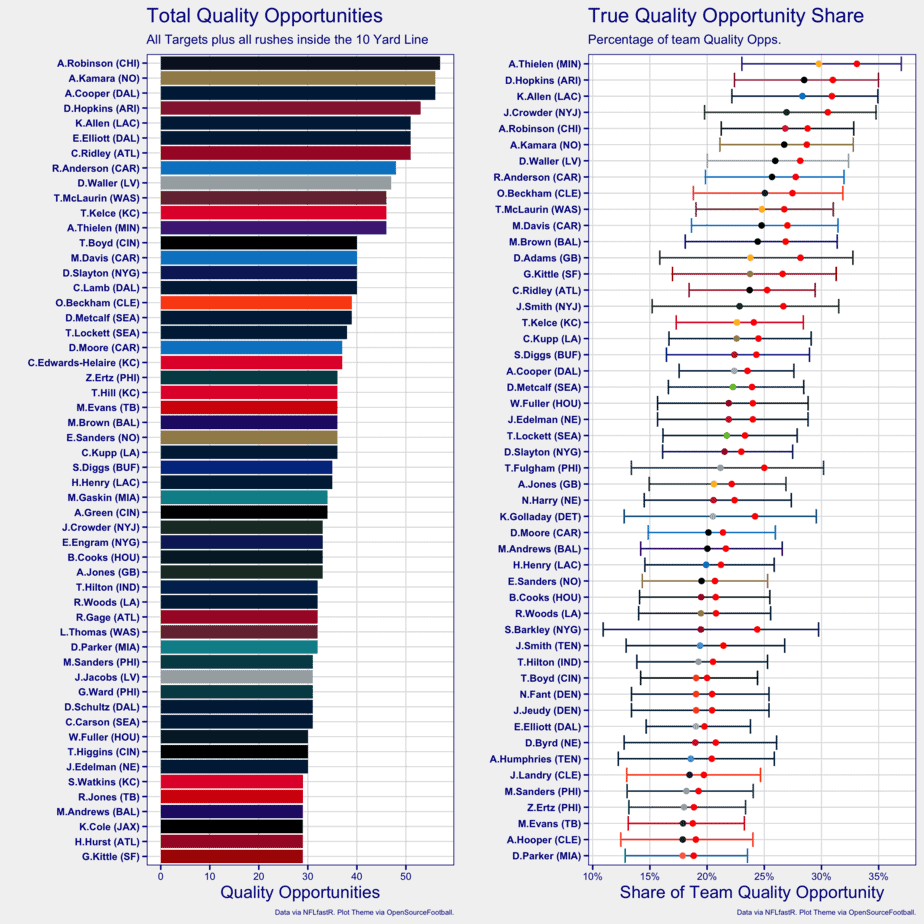
High-Value Opportunities (Click Graph to Enlarge)
Condensed Passing Offenses for NFL DFS Stacks (Click Graph to Enlarge)
- Jacksonville spreads the ball out more than any other team, and they’re one of the lowest-volume pass offenses. Playing Gardner Minshew on his own in NFL DFS might be smarter than focusing on top options.
- The same goes for the other Florida teams; the Buccaneers and Dolphins are both bottom five in passing game consolidation.
- Pittsburgh’s introduction of Chase Claypool in recent weeks skews their metric towards the bottom. They should be closer to the middle over the next few weeks.
- Justin Jefferson is doing his best Stefon Diggs impression, at least in terms of percentage share of the team’s weighted opportunity. He has very similar WOPR metrics to Diggs in 2019.
- Baltimore’s pass offense is much more consolidated around their top two pass catchers (Mark Andrews, Marquise Brown) than in recent years.
[table id = 1404 /]
Bell Cow Backs (Click Graph to Enlarge)
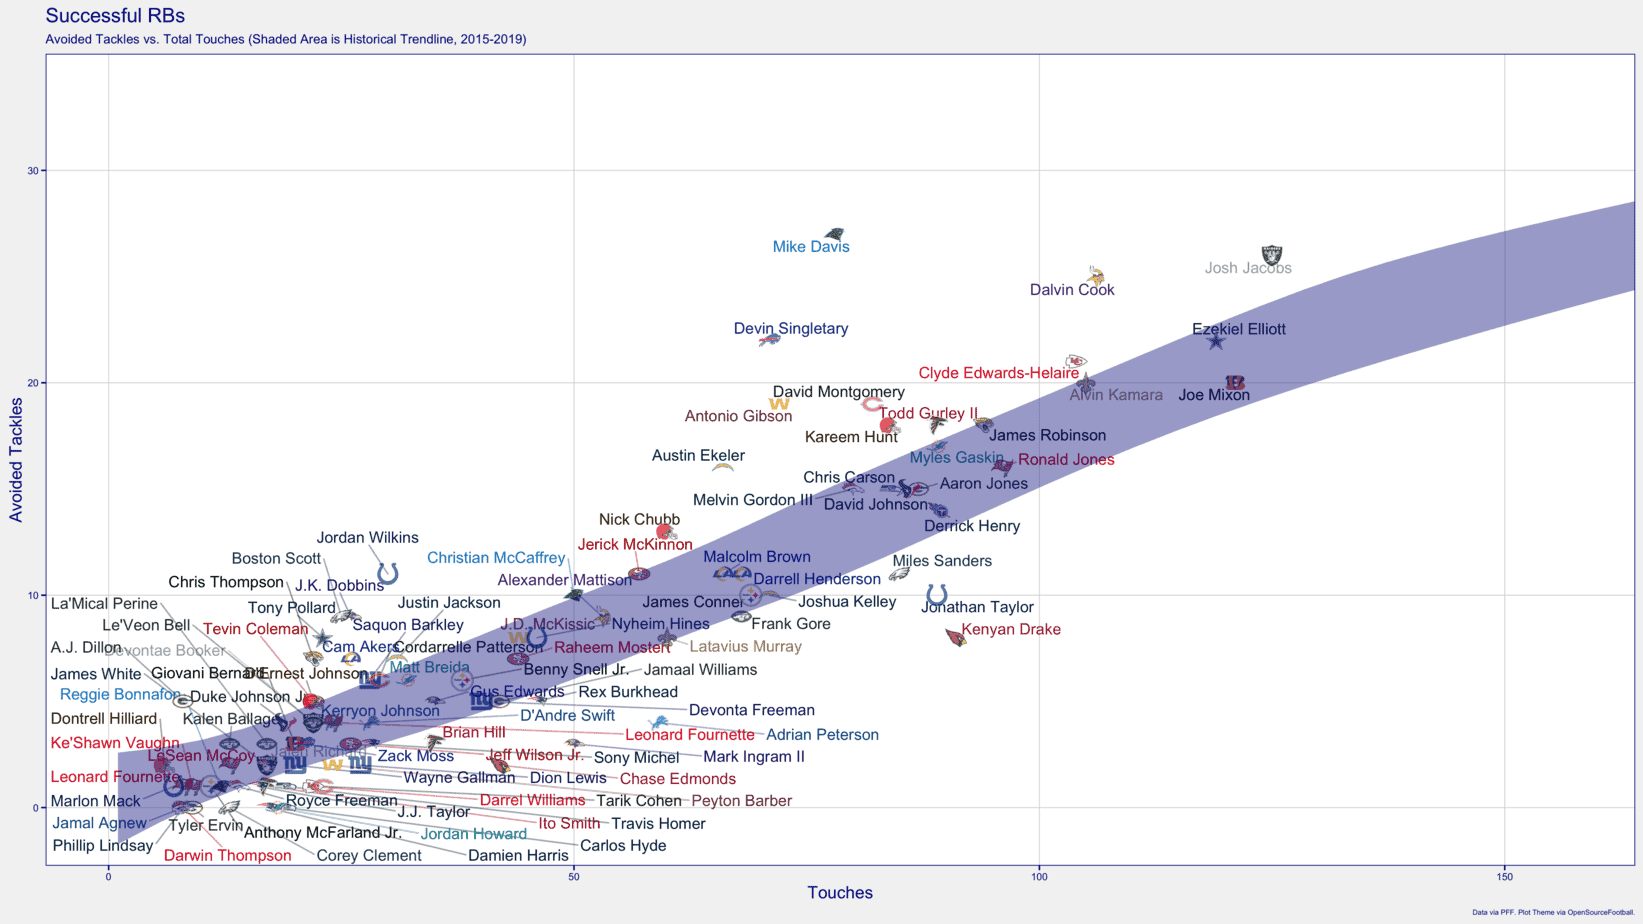
- Josh Jacobs continues to lead the league in touches, though Jon Gruden has hinted at limiting Jacobs’ workload and getting Devontae Booker more run in the coming weeks. I’ll believe it when I see it.
- Dalvin Cook will be severely missed if he misses even just one week due to a groin strain in Week 5. To the extent running backs matter toward winning, Cook is one of them that does.
- The upper-tier has a new face (for 2020) that should be familiar — Todd Gurley. He’s now above the historical trendline for avoided tackles. He’s playing well in Atlanta for a struggling team.
- La’Mical Perine and Le’Veon Bell have legitimate gripes with their coach (update: Gase won the gripe-war against Bell and Bell got booted from the Jets after this article’s submission). Frank Gore has not been efficient on his touches by any means, and yet remains the focal point of the Jets’ backfield.
- Justin Jackson did a decent enough Austin Ekeler impression for the Chargers in Week 5. He’s ascended above the trendline as his touch count continues to increase.
- Jordan Wilkins has been the most efficient Colts back on a per-touch basis.
PFF Grade Net Advantages (Click Graph to Enlarge)
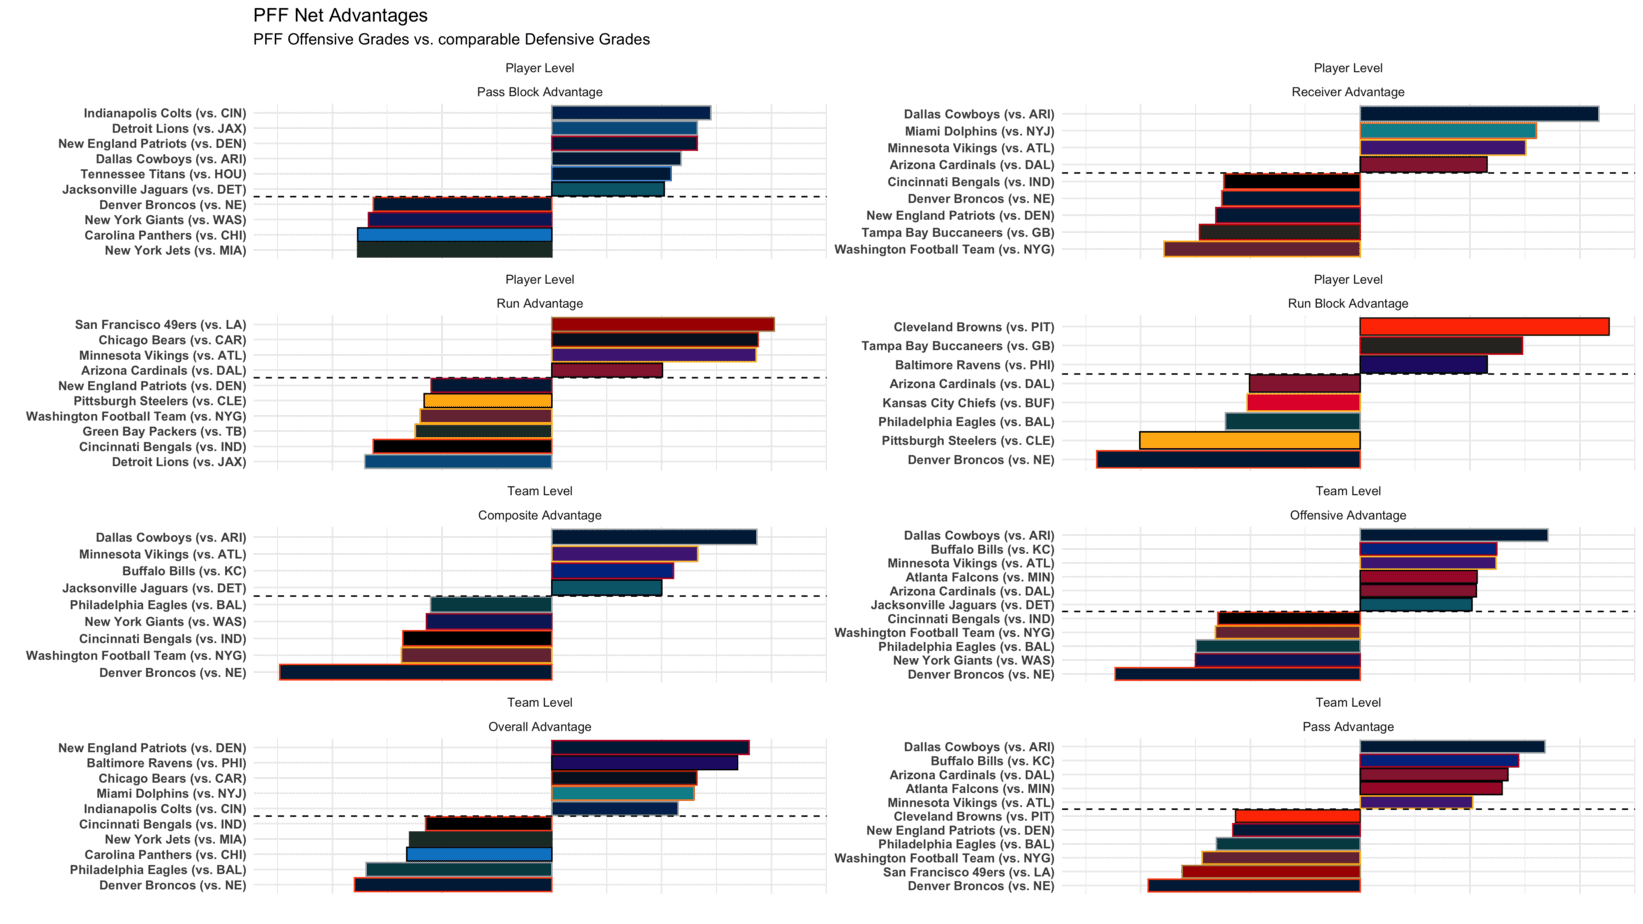
- It’s not safe to trust the Cowboys’ No. 1-ranked composite advantage with a new quarterback under center for the rest of the season.
- Miami should roast the Jets in the passing game. It could be another good week to look at Ryan Fitzpatrick in NFL DFS.
- The Vikings have an implied total of 30 points this week against a middling Falcons defense who can’t stop anybody.
- Regardless of their starting quarterback, Washington should have a legitimate chance to win against the lowly division rival Giants due to their ferocious defense.
- Things don’t look nearly as rosy for Carolina as they did a week ago versus the Falcons. It’s going to be tough to trust Teddy Bridgewater, Mike Davis or any of the Panthers’ pass catchers against a staunch Bears squad in Week 6.
[table id = 1405 /]
Follow us on all of our social channels! Check out our Twitter, Facebook, Instagram and YouTube for more great Awesemo content.
Looking for more NFL DFS picks + Fantasy football content? We’ve got loads of articles, data, cheatsheets and more on the Awesemo NFL home page, just click HERE.