The NFL Data Deep Dive goes beyond the box score, looking into the advanced metrics you need to know in order to make informed fantasy football decisions. After games wrap each week, Matt Savoca shows a look behind the curtain to his process, delivering the visualizations and proprietary statistics along with some quick-hitter thoughts that he uses to prepare for his weekly Main Slate Matchups column, published every Thursday, right here on Awesemo.com. Let’s dig into the data from Week 6 as we look ahead to Week 7 of the daily fantasy football season and NFL DFS slates.
HALLOWEEN PROMOTION
Use promo code PUMPKIN when you sign up for an Awesemo+ pass to get an All Access Awesemo+ Platinum Weekly package for just $10.31 (offer valid until 10/31). That includes access to ALL of our premium data, projections, articles, rankings, ownership, premium slack chat and MORE. Just click HERE to sign up!
For a full list of all our NFL DFS and fantasy football content this season, check out the NFL content schedule.
And don’t forget to join Matt Savoca and Dave Loughran, every Thursday morning at 11 ET on the Awesemo YouTube channel.
Team Efficiency (Click Graph to Enlarge)
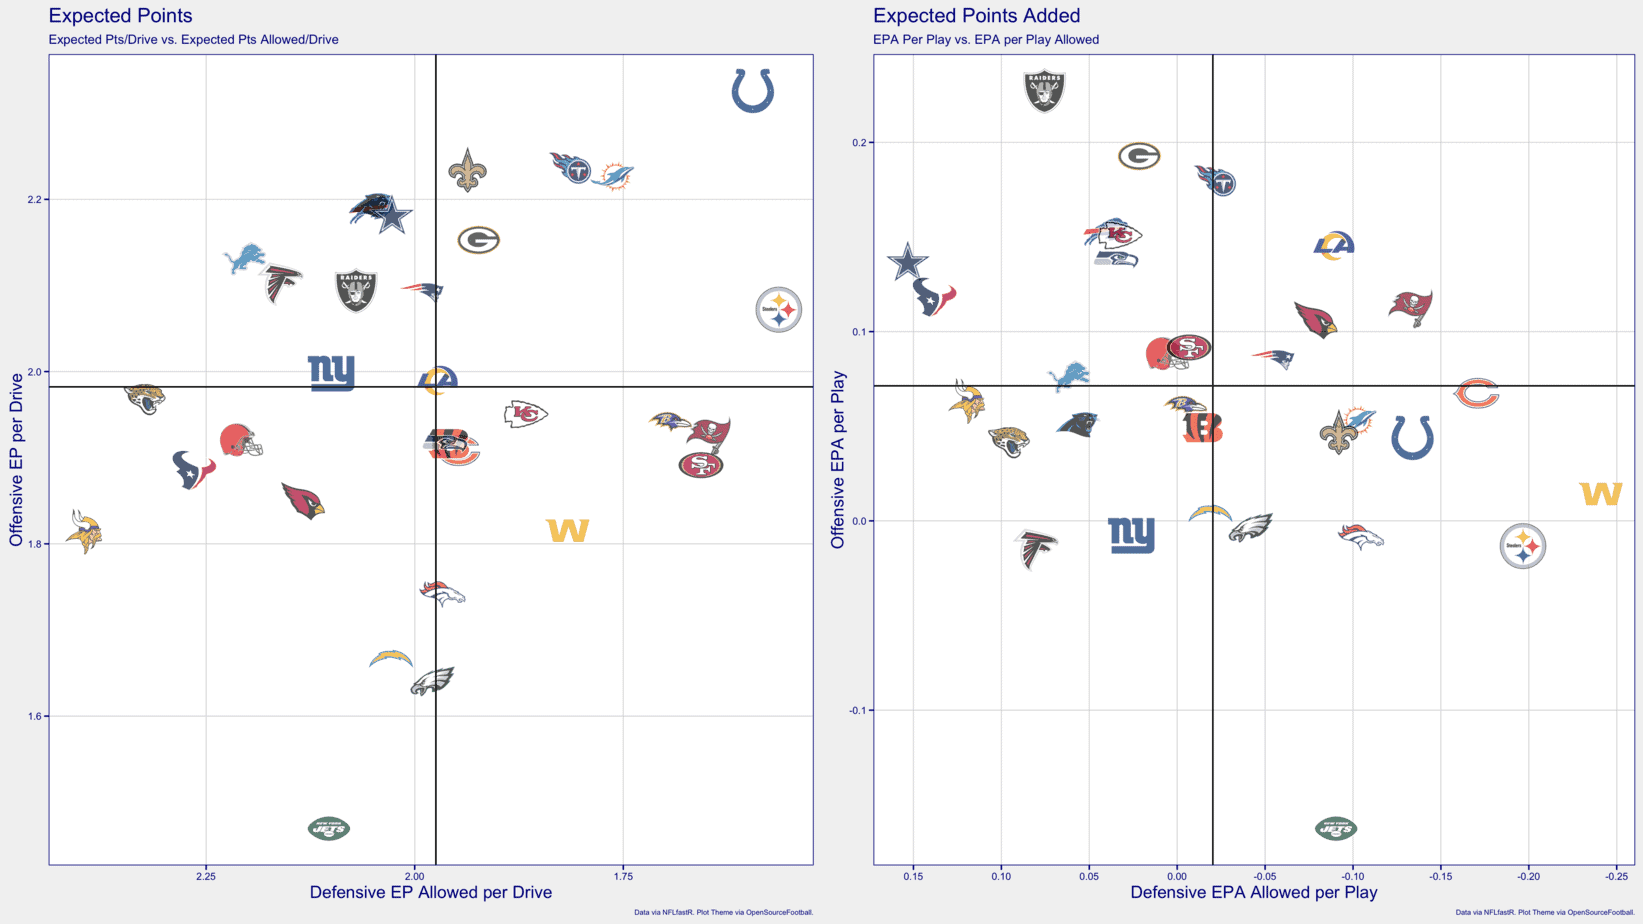
- Look at the Jets. Enjoy a chuckle.
- Despite a win in week 6, the Colts are underperformers relative to their expected points per drive and defensive expected points allowed.
- Coming off their bye week, the Raiders have been arguably one of the most efficient teams in the NFL this season on offense. They’re defense is still below average any way you slice it.
- Arizona enters the “semi-elite” tier in per-play efficiency, after doing whatever they wanted on both sides of the ball against Dallas.
- With two straight losses, it’s clear that Buffalo’s defense (even though they played Tennessee and Kansas City their last two games) is the unit letting it down currently. That’s a reversal of a multi-year trend.
- Tampa Bay has entered the upper echelon of teams in terms of per-play efficiency, but they’re clustered with conservative, run-focused squads in expected points per drive (the graph on the left)
- If it weren’t for the jokes in the NFC East (and the Jets), much more would be made about how hellaciously bad the Vikings have been on both sides of the ball.
Team Aggressiveness (Click Graph to Enlarge)
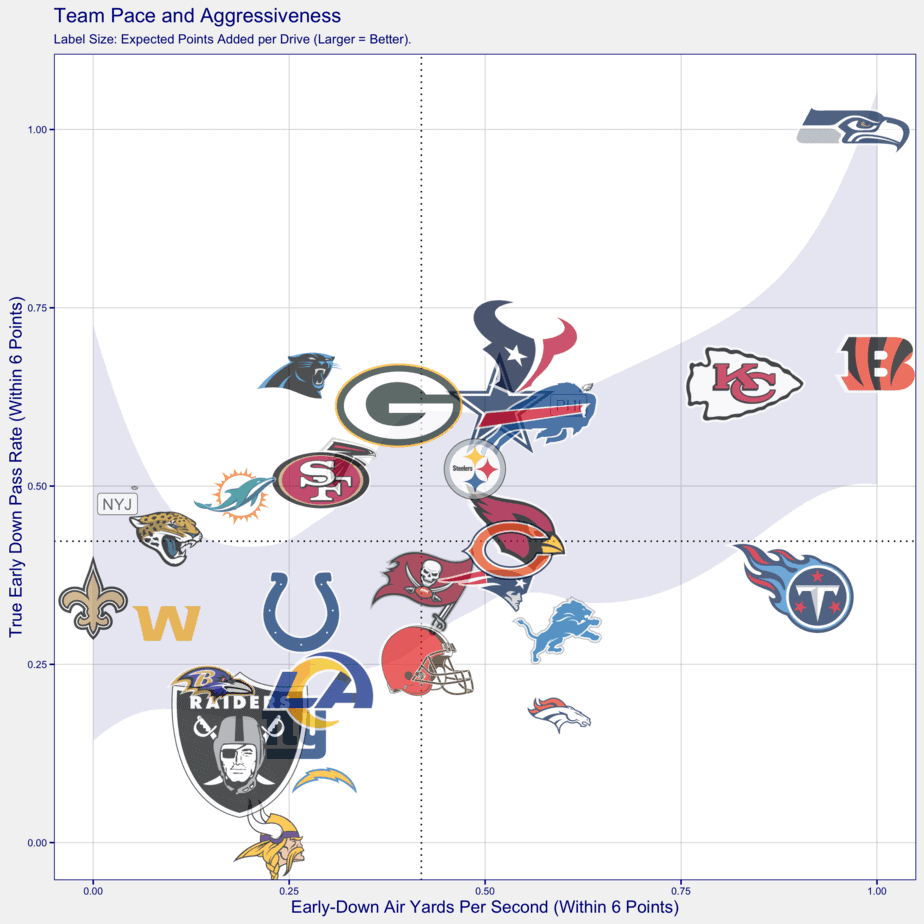
- The may have taken away NFL may have shelved Jameis Winston’s aggressive, high-variance brand of of quarterbacking, but in his place we have Joe Burrow. Burrow may be fine long-term, but his inefficiency relative to a massive passing workload is something to monitor.
- The Chiefs enter the upper echelon of pass-focused aggressive squads, which makes all the sense in the world considering their quarterback.
- Ryan Tannehill and the Titans are one of the most sneaky aggressive teams in the league. They’re proof that just because you’re run-oriented doesn’t preclude you from being aggressive on early downs.
- The Rams’ slow, run-first, short passing game looks terrible when they’re down multiple scores. This team will struggle when playing from behind.
- Drew Lock and Matthew Stafford are being asked to do similar things in neutral game scripts. Neither get enough opportunities to pass on early downs, but when they do, they’re often throwing deep.
- Don’t expect that Dallas logo to stay where it is for very long
- Russell Wilson, QB1. Hat tip to coach Pete Carroll and offensive coordinator Brian Schottenheimer for changing up their typically conservative offensive schemes for an offensive plan that showcases their world class quarterback.
[table id = 1409 /]
Quarterback Efficiency (Click Graph to Enlarge)
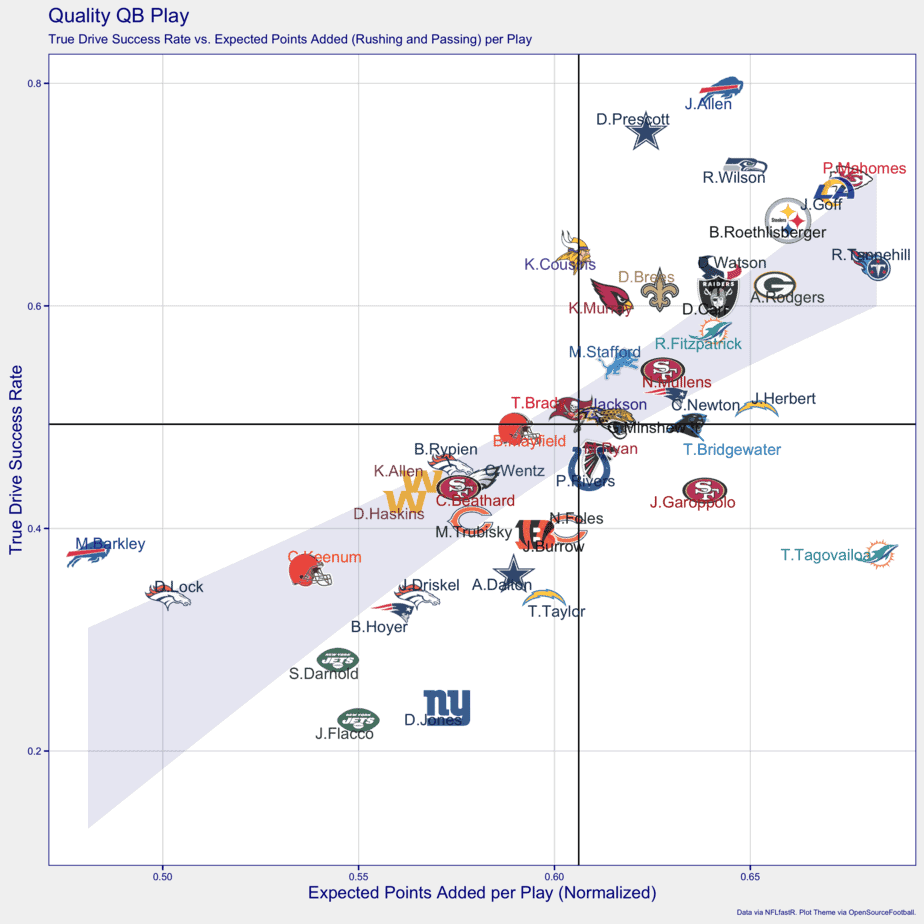
- Don’t look at now, but Patrick Mahomes may end up with another MVP award if he keeps this up.
- Josh Allen, even after two tough losses, continues to play at an elite level
- The “1-B” tier of 2020 quarterbacks now includes Ben Roethlisberger along with Aaron Rodgers and Deshaun Watson.
- Even after an abysmal Sunday night performance, Jared Goff remains in the top tier of signal-callers in these metrics.
- With a larger sample size, Lock should move, at the very least, into the “average” tier of quarterbacks. The same likely can’t be said about Daniel Jones.
- Justin Herbert is the Rookie of the Year if the season ended today, and his only competition is a pair of wide receivers.
[table id = 1406 /]
Skill-Player Opportunities for NFL DFS (Click Graph to Enlarge)
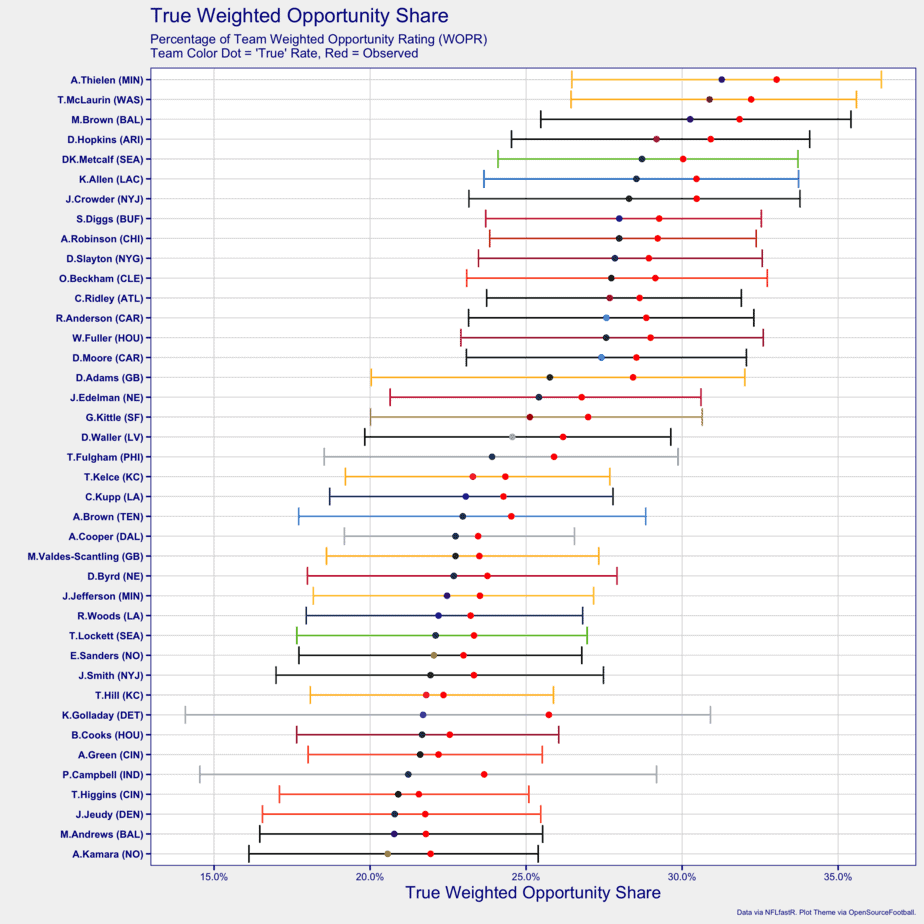
- Terry McLaurin caught a touchdown in week 6, but his production relative to his second-best true weighted opportunity share is an indictment of the Washington quarterback play more than anything else.
- Jamison Crowder is the lone quality option on the lowest-quality team in the NFL
- The top 20 now includes Travis Fulgham, who should see a workload boost with Zach Ertz out for the next few weeks
- No surprise that A.J. Brown enters the top 40 after two fantastic weeks since returning from a bone bruise in his knee
- The Patriots’ second-most utilized pass catcher is now Damiere Byrd, not 2019 first-rounder N’Keal Harry. It’s shaping up to be yet another disappointing season for the New England receiver.
- Tee Higgins and A.J. Green are Burrow’s most targeted receivers, though Tyler Boyd, mostly due to a lower average depth of target, doesn’t make the top 40 list.
- George Kittle has officially passed Darren Waller as the most heavily utilized tight end. Travis Kelce‘s right there with them as well.
NFL DFS High-Value Opportunities (Click Graph to Enlarge)
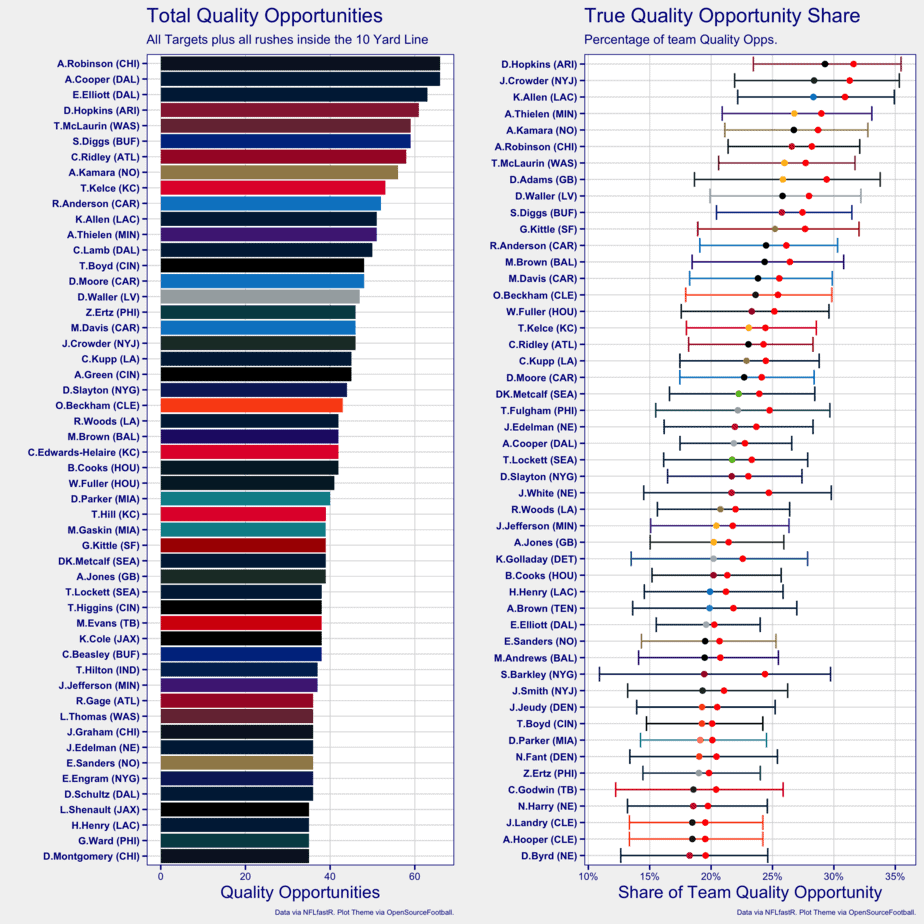
- The Eagles losing Ertz for an extended period will drastically change the distribution of the team’s quality opportunities. Expect Fulgham and Greg Ward to move up the chart
- Brandin Cooks has skyrocketed up the quality opportunity list after two highly productive weeks. He’s now ahead of Will Fuller in total quality opportunities for the year, but Fuller leads in the quality opportunity share.
- CeeDee Lamb is having a remarkable rookie season. He’s now entered the top 15 in total quality opportunities
- Russell Gage might be the most surprising name on the list. It’s a testament to the insanely high rate at which Atlanta continues to pass the ball.
[NFL-Content-Links]
Condensed Passing Offenses for NFL DFS Stacks (Click Graph to Enlarge)
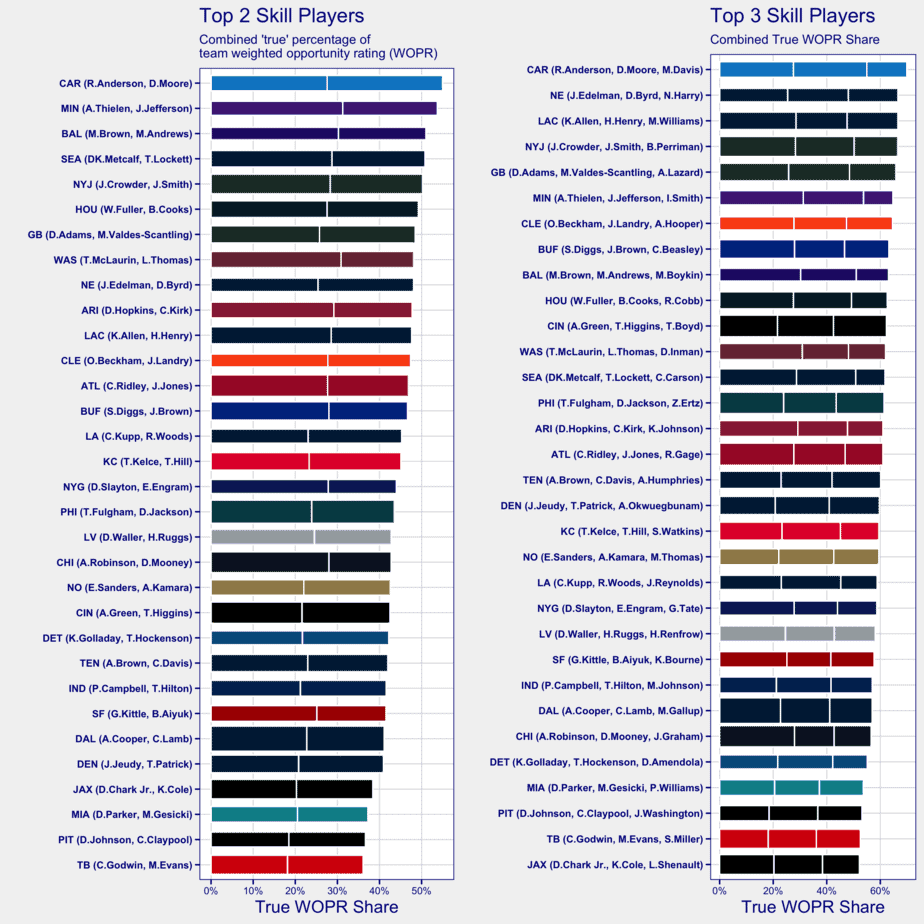
- The Panthers’ offense is by far the most consolidated in the league. Since the top three list includes running back Mike Davis, stacking the Panthers remains extremely simple.
- Five teams have two players that make up 50% of the passing offense: Carolina, Minnesota, Baltimore, Seattle and the Jets. Are we stacking them against the Bills this weekend? No.
- Washington has another high opportunity, low-production pair. It’s likely much more advantageous to move further down the list to the Cardinals, Chargers or Falcons.
[table id = 1407 /]
NFL DFS Bell Cow Backs (Click Graph to Enlarge)
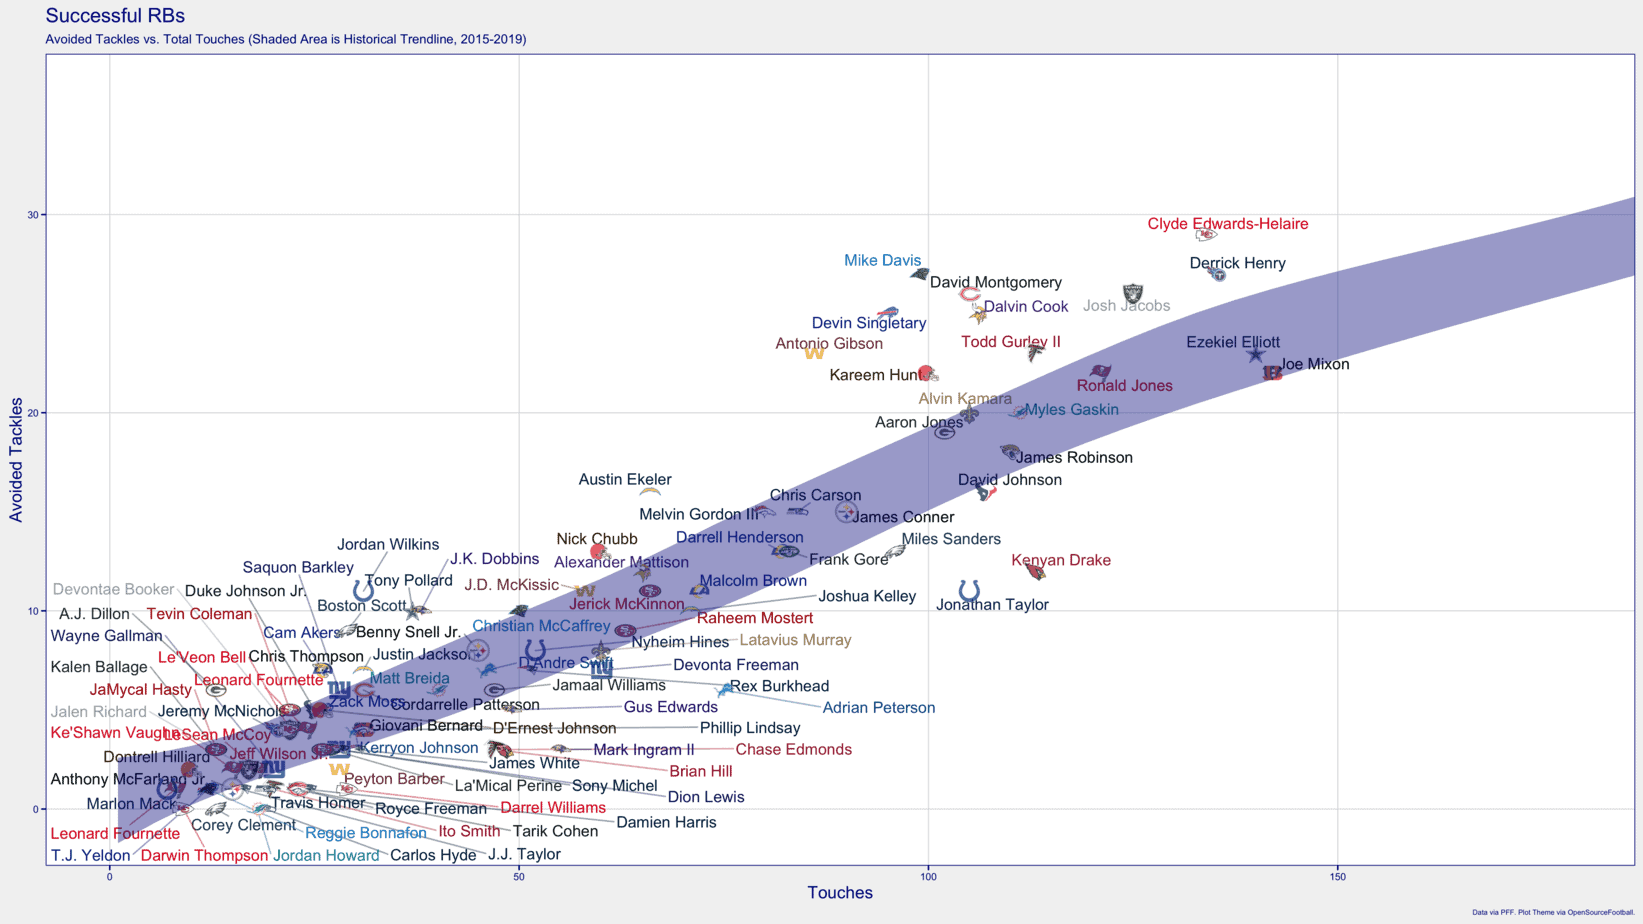
- It’ll be a short stay in the upper-right for Clyde Edwards-Helaire. The Bills made a clear choice to let Edwards-Helaire beat them in week 6, in an effort to slow Mahomes. It nearly worked, though Buffalo came up short in the end.
- Antonio Gibson’s workload dwindled a bit Sunday, but he’s still in the “1-B” tier of backs this season. Any improvement in the quality of the offense should skyrocket Gibson’s value. We’ll likely have to wait until 2021 or after, however.
- James Robinson and Myles Gaskin are two names in the upper tier that no one saw coming during the preseason.
- Ronald Jones’ has been given the lion’s share of touches in the Tampa Bay backfield, and has performed rather admirably. He’ll cede work to a healthy Leonard Fournette, but expect at least a 60/40 split in Jones’ favor nonetheless.
- Kenyan Drake’s 60-plus yard explosion to cap off a victory in week 6 was great for fantasy gamers, but it still doesn’t change the fact that he’s drastically underperforming in the avoided tackles department relative to his touch count.
PFF Grade Net Advantages (Click Graph to Enlarge)
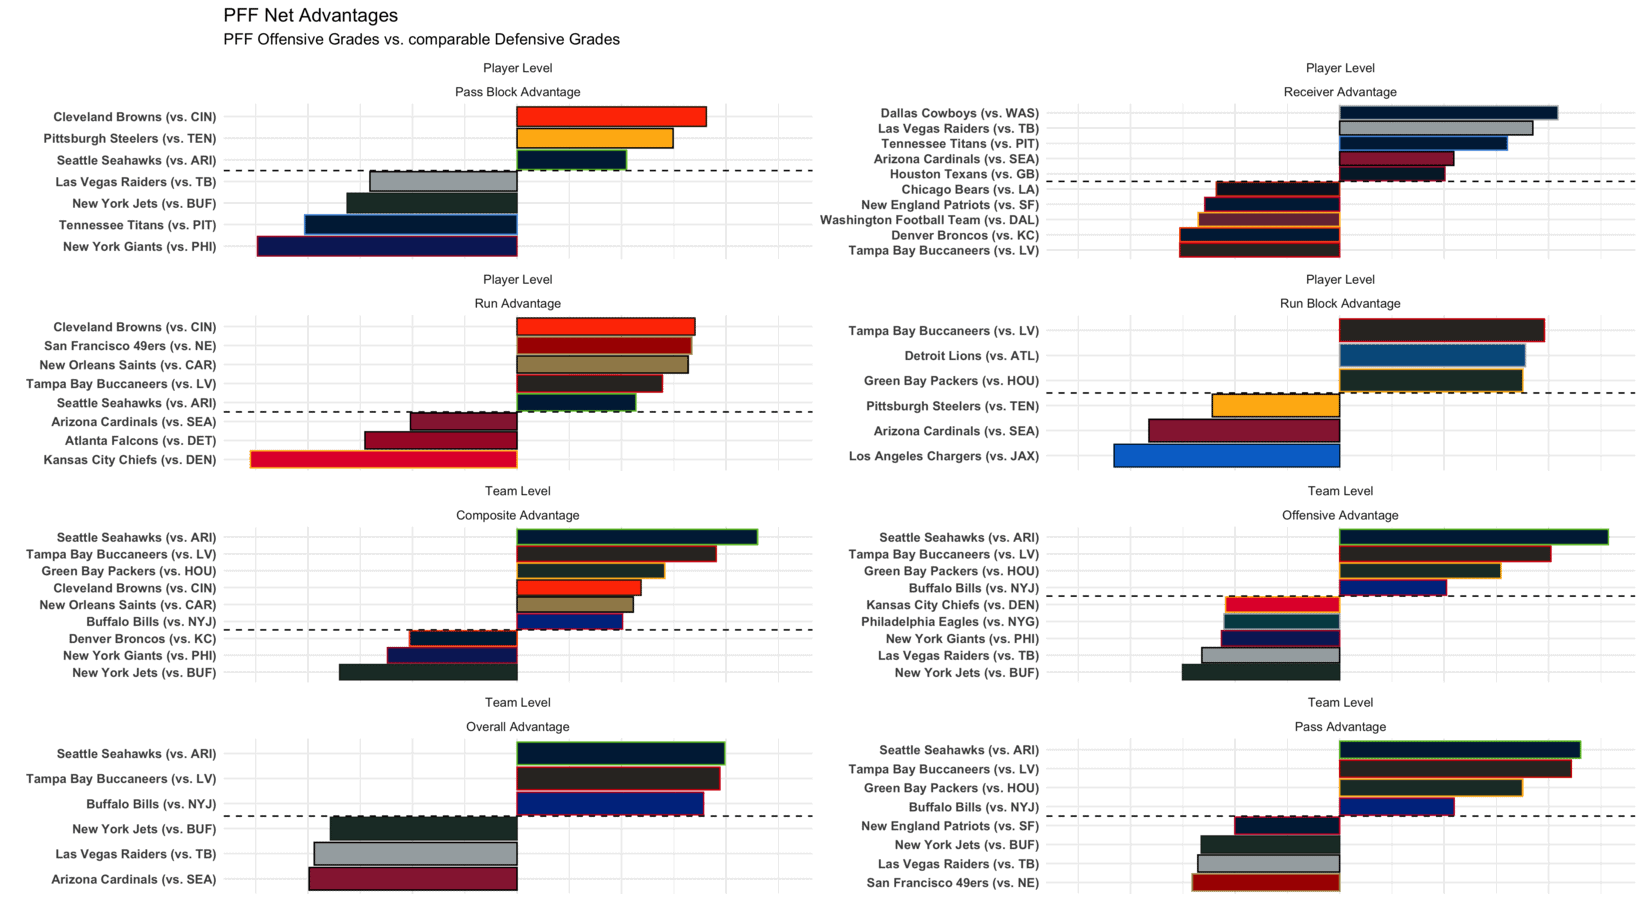
- Even after smacking Dallas on Monday night football, Arizona looks to have a major disadvantage against division-rival Seattle this weekend
- Equally surprising is Las Vegas’ massive underdog status against Tampa Bay despite the Raiders taking down the Chiefs in week 5.
- A surprising team in the Offensive Advantage chart: The Kansas City Chiefs. Do the Broncos have a chance against the champs in week 7?
- The Browns have a decent chance of getting back in the win column against the Bengals this weekend. They need to keep Baker Mayfield upright, so it’s especially encouraging to see Cleveland out ahead in the Pass Block Advantage chart.
[table id = 1408 /]
Follow us on all of our social channels! Check out our Twitter, Facebook, Instagram and YouTube for more great Awesemo content.
Looking for more NFL DFS picks + Fantasy football content for Week 7? We’ve got loads of NFL DFS articles, data, cheatsheets and more on the Awesemo NFL home page, just click HERE.