Matt Savoca’s Daily Fantasy Football Matchups Column returns for Week 14 of the NFL DFS season. In it, he goes through every single game on the NFL DFS main slate on Sundays for your season-long fantasy football lineups on Yahoo, ESPN and CBS and your NFL DFS picks on DraftKings and FanDuel. We have 13 games on tap for Week 14, so let’s dive into the action.
Week 14 NFL DFS Matchups Breakdown
Daily Fantasy Football Matchups: Early Games
Kansas City Chiefs at Miami Dolphins
Denver Broncos at Carolina Panthers
Arizona Cardinals at New York Giants
Houston Texans at Chicago Bears
Dallas Cowboys at Cincinnati Bengals
Minnesota Vikings at Tampa Bay Buccaneers
Tennessee Titans at Jacksonville Jaguars
Daily Fantasy Football Matchups: Afternoon Games
Indianapolis Colts at Las Vegas Raiders
New York Jets at Seattle Seahawks
New Orleans Saints at Philadelphia Eagles
Washington Football Team at San Francisco 49ers
Atlanta Falcons at Los Angeles Chargers
Green Bay Packers at Detroit Lions
Kansas City Chiefs (28) at Miami Dolphins (20.5)
All Graphs Reflect Last Five Weeks of Data, Click Graphs to Enlarge
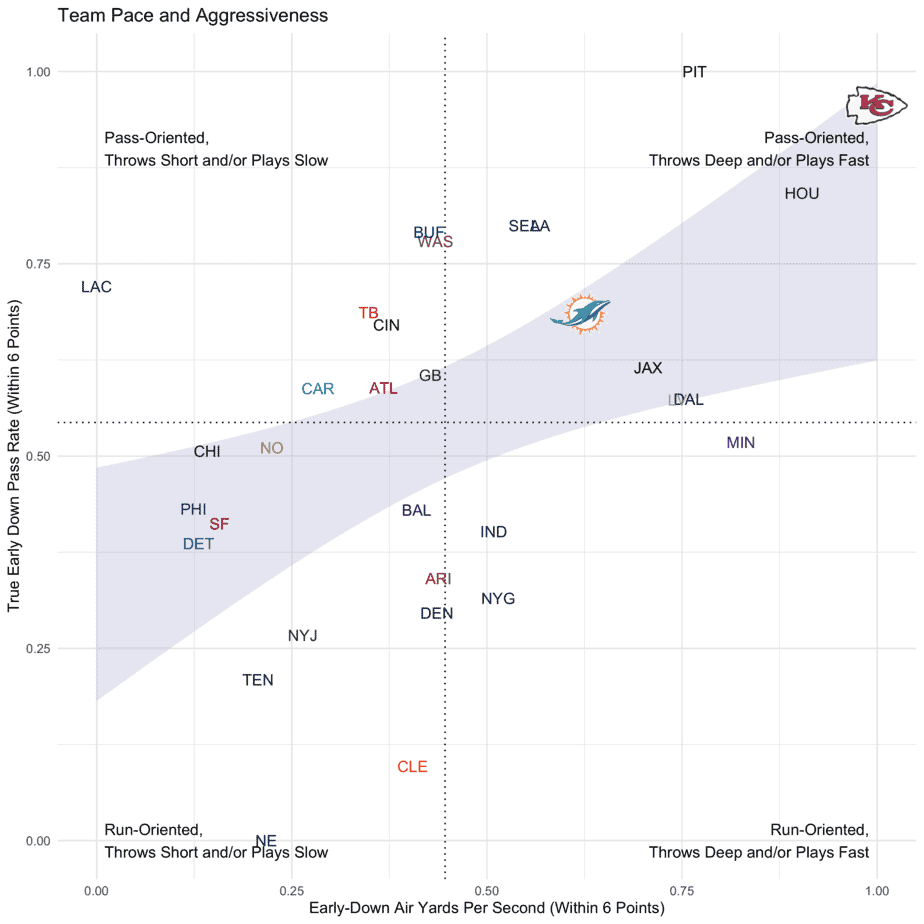
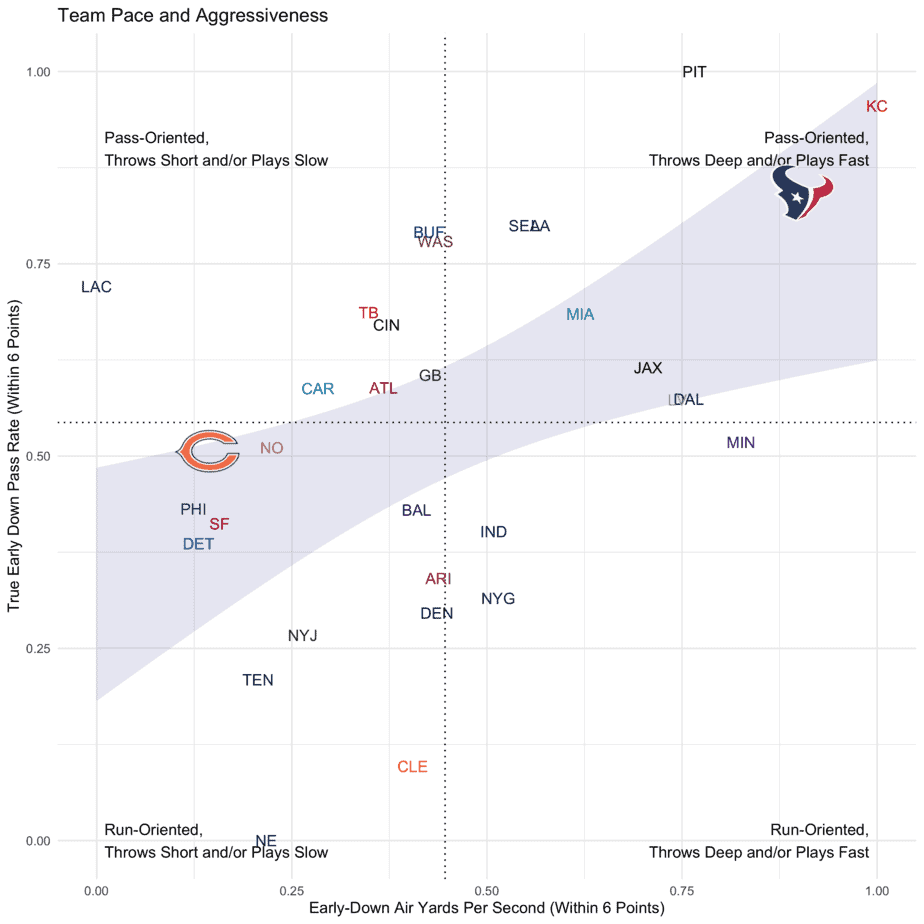
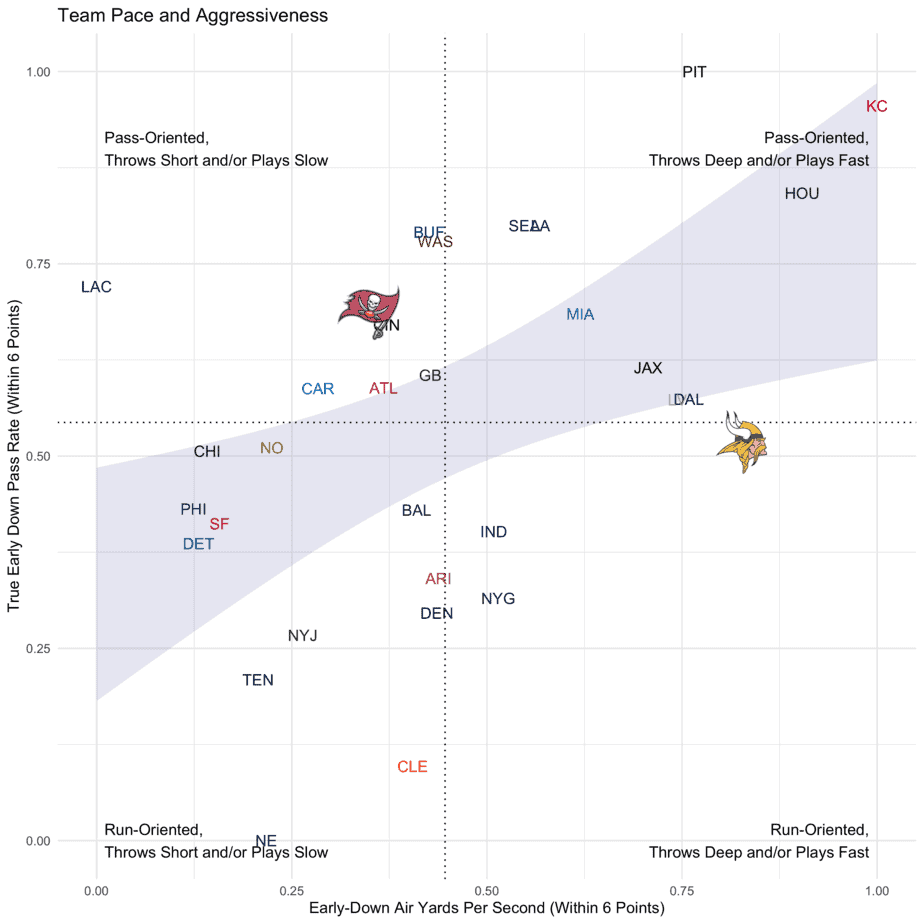
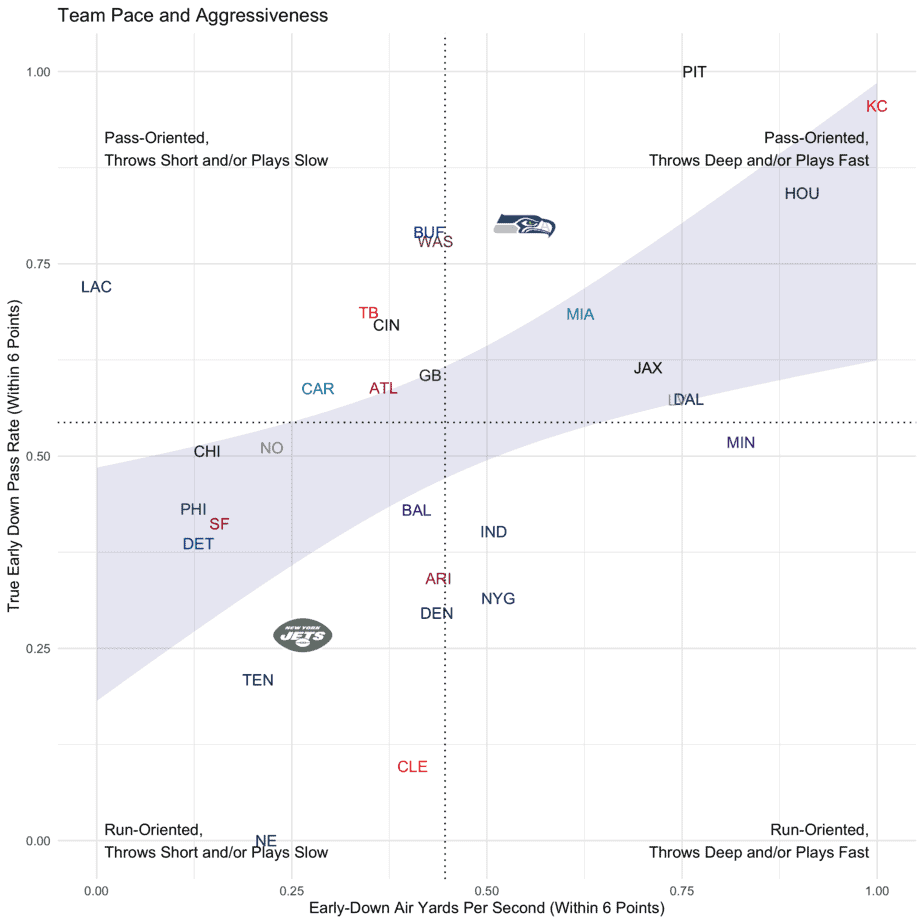
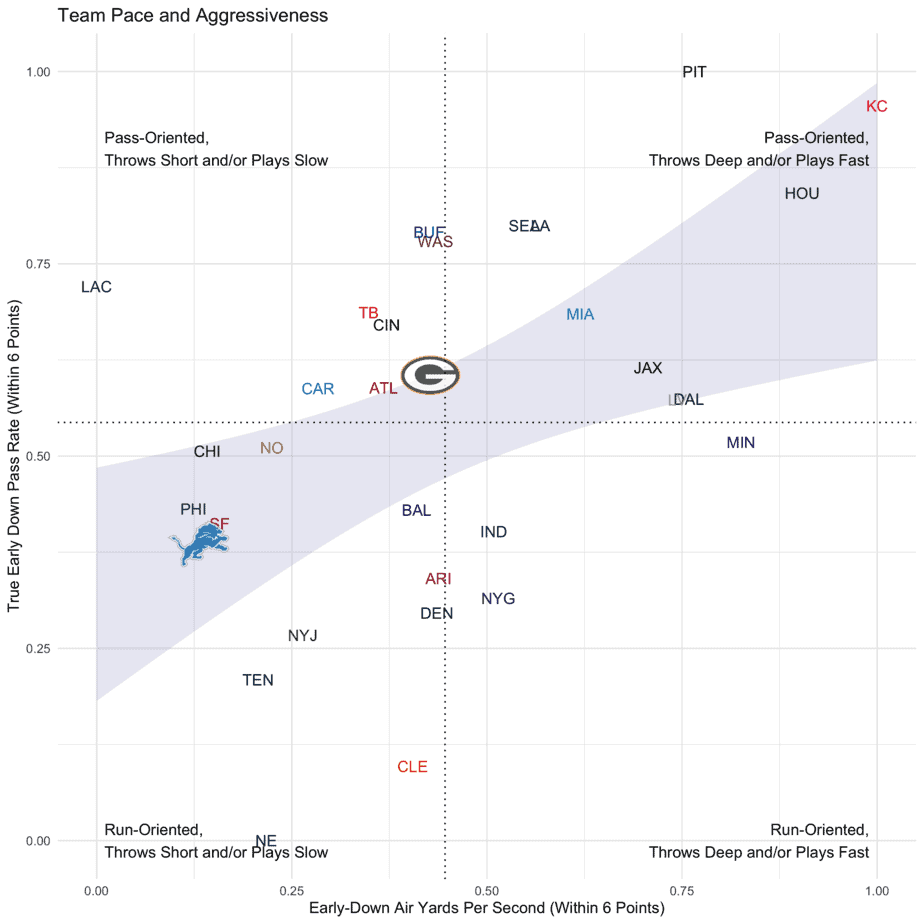
Team Passing and Pace
Quarterback Play
NFL DFS Core Offenses
Let’s examine the primary skill players from each offense. For each player, their salary is compared to their fantasy points per game in column 2. Column 3 lists each player’s expected fantasy points (an excellent “catch-all” metric to measure usage) and fantasy points scored above or below expectation, a great proxy for efficiency. “DvP” measures the opposing defense’s fantasy points per game allowed above or below opponent averages. Finally, “xPROJ” combines a player’s expected fantasy points with their weekly matchup into one “expected projection” metric, which can be used to determine a player’s floor and ceiling.
Kansas City Chiefs NFL DFS Picks
| Player | Salary and FPts/Gm | Expected FPts & FPts vs. Expected | DvP (Rk) / DvP, Last 5 (Rk) | xPROJ |
| Patrick Mahomes, QB | $8100 (#1) / 26 FPts/Gm (#2) | 22.8 xFPTs/Gm (#2) / +3 FPvE (#4) | -1.2 FPA vs Avg (#12) / -1.9 FPA vs. Avg (#8) | 21.5 Fpts (QB5), -4.3 vs. Avg |
| Travis Kelce, TE | $7400 (#1) / 23.5 FPts/Gm (#1) | 20.1 xFPTs/Gm (#1) / +3.2 FPvE (#2) | +0.2 FPA vs Avg (#18) / +1.6 FPA vs. Avg (#24) | 20.5 Fpts (TE1), -2.8 vs. Avg |
| Tyreek Hill, WR | $8500 (#2) / 27.5 FPts/Gm (#2) | 22.9 xFPTs/Gm (#2) / +4.6 FPvE (#2) | -3.6 FPA vs Avg (#4) / -4.1 FPA vs. Avg (#4) | 21 Fpts (WR2), -6.5 vs. Avg |
| Clyde Edwards-Helaire, RB | $5900 (#17) / 13 FPts/Gm (#19) | 13.9 xFPTs/Gm (#16) / -1 FPvE (#62) | +1.2 FPA vs Avg (#21) / -1.5 FPA vs. Avg (#18) | 14.5 Fpts (RB16), +1.6 vs. Avg |
Miami Dolphins NFL DFS Picks
| Player | Salary and FPts/Gm | Expected FPts & FPts vs. Expected | DvP (Rk) / DvP, Last 5 (Rk) | xPROJ |
| Tua Tagovailoa, QB | $5400 (#19) / 11 FPts/Gm (#27) | 12.7 xFPTs/Gm (#27) / -1.5 FPvE (#26) | -1.3 FPA vs Avg (#11) / +0.3 FPA vs. Avg (#16) | 11.5 Fpts (QB23), +0.3 vs. Avg |
| Myles Gaskin, RB | $5600 (#21) / 11 FPts/Gm (#27) | 14.6 xFPTs/Gm (#13) / -3.5 FPvE (#88) | +2 FPA vs Avg (#22) / -0.4 FPA vs. Avg (#20) | 16 Fpts (RB11), +4.9 vs. Avg |
| DeVante Parker, WR | $6100 (#20) / 13 FPts/Gm (#38) | 12.3 xFPTs/Gm (#39) / +0.6 FPvE (#47) | -1 FPA vs Avg (#13) / +1.4 FPA vs. Avg (#24) | 11.5 Fpts (WR32), -1.4 vs. Avg |
| Mike Gesicki, TE | $4500 (#5) / 10.5 FPts/Gm (#7) | 9.7 xFPTs/Gm (#9) / +1 FPvE (#10) | +0.6 FPA vs Avg (#19) / +2 FPA vs. Avg (#25) | 10 Fpts (TE9), -0.7 vs. Avg |
| Jakeem Grant, WR | $3400 (#67) / 5 FPts/Gm (#91) | 5.5 xFPTs/Gm (#92) / -0.6 FPvE (#96) | -4.4 FPA vs Avg (#3) / -9 FPA vs. Avg (#1) | 4.5 Fpts (WR78), -0.4 vs. Avg |
Running Back Quality Opportunities
Auxiliary Offenses
For lesser-utilized offensive players, let’s examine usage based on snap share, quality opportunity share and matchup. For each player, I categorize them as an NFL DFS value, a mass multi-entry option (MME-only) or a player to avoid altogether.
Kansas City Chiefs NFL DFS Picks
| Player | Snap Share, Last 5 Weeks | True Quality Opp Share/True WOPR Share, Last 5 Weeks | DvP (Rk) / DvP, Last 5 (Rk) | Outlook: Value, MME-only, Look Elsewhere |
| Sammy Watkins, WR | 73.5% | 14.4% / 13% | +3.4 FPA vs Avg (#27) / +6.7 FPA vs. Avg (#27) | MME-Only |
| Le’Veon Bell, RB | 32.5% | 6.6% / 3.6% | +1.2 FPA vs Avg (#21) / -1.5 FPA vs. Avg (#18) | MME-Only |
| Demarcus Robinson, WR | 73.0% | 11.5% / 11.5% | -0.7 FPA vs Avg (#13) / -1.4 FPA vs. Avg (#8) | MME-Only |
| Mecole Hardman, WR | 42.5% | 9.4% / 10.4% | -0.7 FPA vs Avg (#13) / -1.4 FPA vs. Avg (#8) | MME-Only |
| Darrel Williams, RB | 23.0% | 4.8% / 3.4% | +1.2 FPA vs Avg (#21) / -1.5 FPA vs. Avg (#18) | Look Elsewhere |
| Deon Yelder, TE | 19.0% | 4.1% / 2.7% | +0.2 FPA vs Avg (#18) / +1.6 FPA vs. Avg (#24) | Look Elsewhere |
Miami Dolphins NFL DFS Picks
| Player | Snap Share, Last 5 Weeks | True Quality Opp Share/True WOPR Share, Last 5 Weeks | DvP (Rk) / DvP, Last 5 (Rk) | Outlook: Value, MME-only, Look Elsewhere |
| Lynn Bowden Jr., RB | 29.5% | 7.7% / 6.6% | +2 FPA vs Avg (#22) / -0.4 FPA vs. Avg (#20) | Look Elsewhere |
| Durham Smythe, TE | 46.5% | 6.6% / 5.3% | +0.6 FPA vs Avg (#19) / +2 FPA vs. Avg (#25) | Look Elsewhere |
| Mack Hollins, WR | 24.5% | 6.2% / 5.2% | +1.5 FPA vs Avg (#27) / +2.1 FPA vs. Avg (#23) | Look Elsewhere |
| Salvon Ahmed, RB | 62.5% | 15% / 8.1% | +2 FPA vs Avg (#22) / -0.4 FPA vs. Avg (#20) | Look Elsewhere |
| Antonio Callaway, WR | 16.5% | 4.8% / 4% | +1.5 FPA vs Avg (#27) / +2.1 FPA vs. Avg (#23) | Look Elsewhere |
| Adam Shaheen, TE | 33.0% | 5.8% / 5.2% | +0.6 FPA vs Avg (#19) / +2 FPA vs. Avg (#25) | Look Elsewhere |
| Patrick Laird, RB | 17.0% | 6.4% / 4.9% | +2 FPA vs Avg (#22) / -0.4 FPA vs. Avg (#20) | Look Elsewhere |
Skill Position Opportunities
Range of Outcomes Analysis: Receiving Opportunity
Prediction: Chiefs 27, Dolphins 17.
Looking for more NFL DFS picks and daily fantasy football matchups content? We have loads of articles, data and more on the Awesemo NFL home page. Just click HERE.
Arizona Cardinals (23.75) at New York Giants (21.25)
All Graphs Reflect Last Five Weeks of Data, Click Graphs to Enlarge
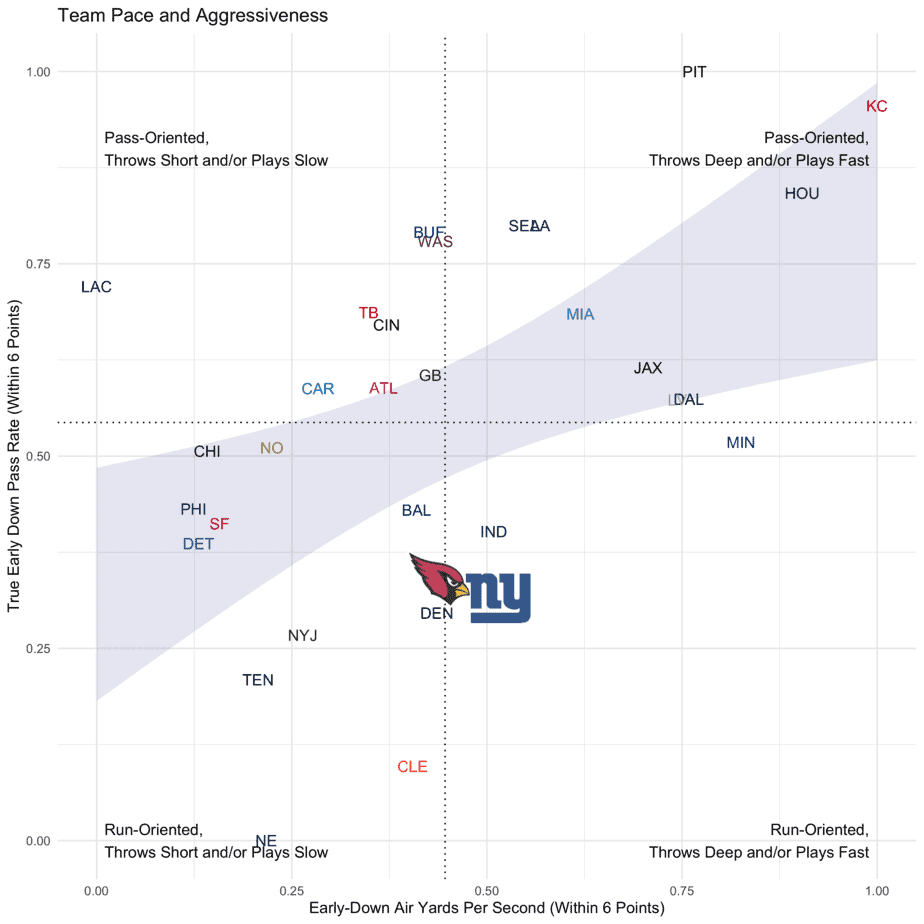
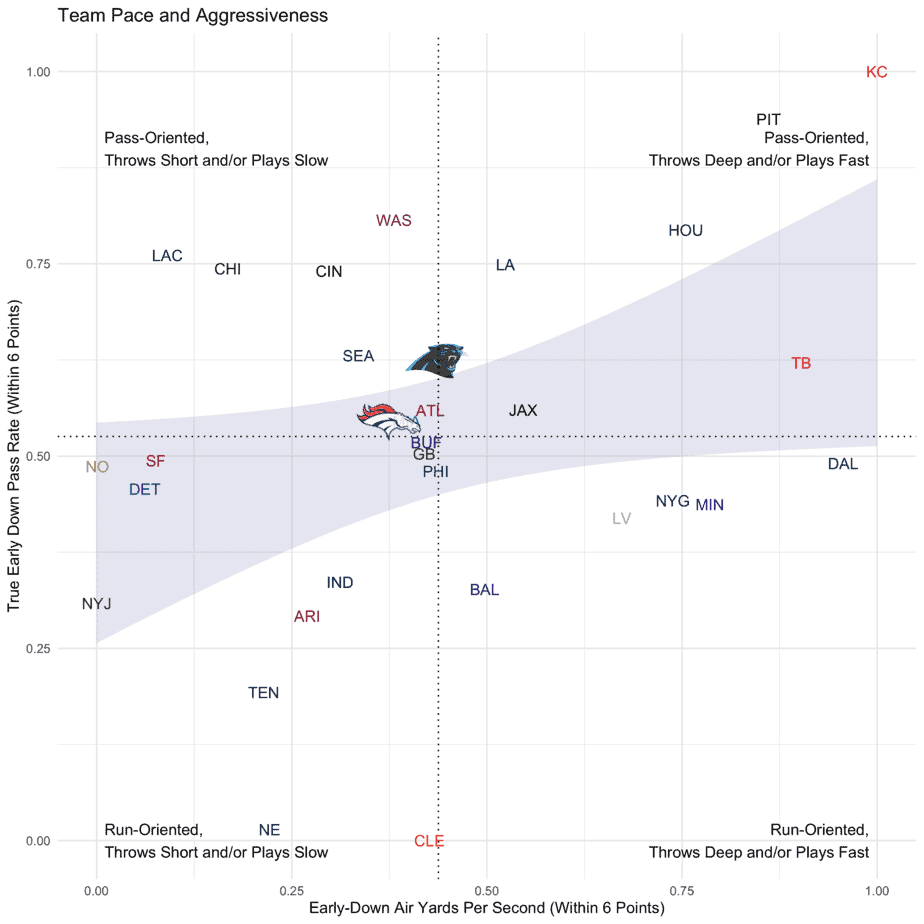
Team Passing and Pace
Quarterback Play
NFL DFS Core Offenses
Let’s examine the primary skill players from each offense. For each player, their salary is compared to their fantasy points per game in column 2. Column 3 lists each player’s expected fantasy points (an excellent “catch-all” metric to measure usage) and fantasy points scored above or below expectation, a great proxy for efficiency. “DvP” measures the opposing defense’s fantasy points per game allowed above or below opponent averages. Finally, “xPROJ” combines a player’s expected fantasy points with their weekly matchup into one “expected projection” metric, which can be used to determine a player’s floor and ceiling.
Arizona Cardinals NFL DFS Picks
| Player | Salary and FPts/Gm | Expected FPts & FPts vs. Expected | DvP (Rk) / DvP, Last 5 (Rk) | xPROJ |
| Kyler Murray, QB | $7200 (#5) / 27 FPts/Gm (#1) | 22.2 xFPTs/Gm (#4) / +4.8 FPvE (#1) | -0.3 FPA vs Avg (#17) / +0.4 FPA vs. Avg (#18) | 22 Fpts (QB3), -5 vs. Avg |
| DeAndre Hopkins, WR | $7600 (#5) / 20 FPts/Gm (#7) | 18.1 xFPTs/Gm (#6) / +1.7 FPvE (#24) | -1.2 FPA vs Avg (#11) / +0.1 FPA vs. Avg (#18) | 17.5 Fpts (WR10), -2.3 vs. Avg |
| Chase Edmonds, RB | $4600 (#39) / 12 FPts/Gm (#26) | 11.3 xFPTs/Gm (#28) / +0.6 FPvE (#19) | +2.2 FPA vs Avg (#23) / +0.4 FPA vs. Avg (#21) | 12.5 Fpts (RB23), +0.6 vs. Avg |
| Kenyan Drake, RB | $5500 (#22) / 12.5 FPts/Gm (#22) | 13.7 xFPTs/Gm (#18) / -1.3 FPvE (#70) | +2.2 FPA vs Avg (#23) / +0.4 FPA vs. Avg (#21) | 15 Fpts (RB13), +2.6 vs. Avg |
| Christian Kirk, WR | $4700 (#40) / 12 FPts/Gm (#40) | 11 xFPTs/Gm (#45) / +1.2 FPvE (#29) | +1.7 FPA vs Avg (#21) / +2.8 FPA vs. Avg (#23) | 11.5 Fpts (WR32), -0.7 vs. Avg |
New York Giants NFL DFS Picks
| Player | Salary and FPts/Gm | Expected FPts & FPts vs. Expected | DvP (Rk) / DvP, Last 5 (Rk) | xPROJ |
| Daniel Jones, QB | $5500 (#17) / 15 FPts/Gm (#22) | 16.1 xFPTs/Gm (#21) / -1.3 FPvE (#23) | +1.5 FPA vs Avg (#24) / -0.6 FPA vs. Avg (#12) | 17.5 Fpts (QB12), +2.7 vs. Avg |
| Sterling Shepard, WR | $5200 (#29) / 10.5 FPts/Gm (#52) | 11.1 xFPTs/Gm (#44) / -0.8 FPvE (#102) | +0.8 FPA vs Avg (#22) / -2 FPA vs. Avg (#10) | 11.5 Fpts (WR32), +1.2 vs. Avg |
| Wayne Gallman Jr., RB | $5700 (#20) / 11 FPts/Gm (#28) | 10 xFPTs/Gm (#34) / +0.8 FPvE (#16) | -1.1 FPA vs Avg (#14) / -4.8 FPA vs. Avg (#6) | 9.5 Fpts (RB28), -1.3 vs. Avg |
| Darius Slayton, WR | $4200 (#48) / 9 FPts/Gm (#57) | 9.7 xFPTs/Gm (#53) / -0.6 FPvE (#96) | +3.4 FPA vs Avg (#27) / +10.1 FPA vs. Avg (#32) | 11 Fpts (WR39), +1.9 vs. Avg |
| Evan Engram, TE | $4300 (#7) / 8 FPts/Gm (#20) | 9.4 xFPTs/Gm (#13) / -1.6 FPvE (#65) | -0.3 FPA vs Avg (#12) / -2.5 FPA vs. Avg (#8) | 9 Fpts (TE12), +1.2 vs. Avg |
| Golden Tate, WR | $3600 (#62) / 8 FPts/Gm (#67) | 7.8 xFPTs/Gm (#75) / +0.3 FPvE (#58) | -1 FPA vs Avg (#11) / +2 FPA vs. Avg (#22) | 7.5 Fpts (WR61), -0.6 vs. Avg |
Running Back Quality Opportunities
Auxiliary Offenses
For lesser-utilized offensive players, let’s examine usage based on snap share, quality opportunity share and matchup. For each player, I categorize them as an NFL DFS value, a mass multi-entry option (MME-only) or a player to avoid altogether.
Arizona Cardinals NFL DFS Picks
| Player | Snap Share, Last 5 Weeks | True Quality Opp Share/True WOPR Share, Last 5 Weeks | DvP (Rk) / DvP, Last 5 (Rk) | Outlook: Value, MME-only, Look Elsewhere |
| Andy Isabella, WR | 41.0% | 9.6% / 10.5% | -2.1 FPA vs Avg (#5) / -1.3 FPA vs. Avg (#9) | MME-Only |
| Larry Fitzgerald, WR | 78.0% | 18.6% / 17.2% | -2.1 FPA vs Avg (#5) / -1.3 FPA vs. Avg (#9) | MME-Only |
| Dan Arnold, TE | 33.0% | 8% / 9.2% | -2.9 FPA vs Avg (#6) / +0.6 FPA vs. Avg (#19) | Look Elsewhere |
| Maxx Williams, TE | 52.5% | 6.3% / 5.3% | -2.9 FPA vs Avg (#6) / +0.6 FPA vs. Avg (#19) | Look Elsewhere |
| KeeSean Johnson, WR | 39.0% | 8.2% / 7% | -2.1 FPA vs Avg (#5) / -1.3 FPA vs. Avg (#9) | Look Elsewhere |
New York Giants NFL DFS Picks
| Player | Snap Share, Last 5 Weeks | True Quality Opp Share/True WOPR Share, Last 5 Weeks | DvP (Rk) / DvP, Last 5 (Rk) | Outlook: Value, MME-only, Look Elsewhere |
| Dion Lewis, RB | 23.5% | 8.6% / 6.4% | -1.1 FPA vs Avg (#14) / -4.8 FPA vs. Avg (#6) | MME-Only |
| Alfred Morris, RB | 20.0% | 8.3% / 4.1% | -1.1 FPA vs Avg (#14) / -4.8 FPA vs. Avg (#6) | MME-Only |
| Kaden Smith, TE | 57.0% | 7% / 5% | -0.3 FPA vs Avg (#12) / -2.5 FPA vs. Avg (#8) | Look Elsewhere |
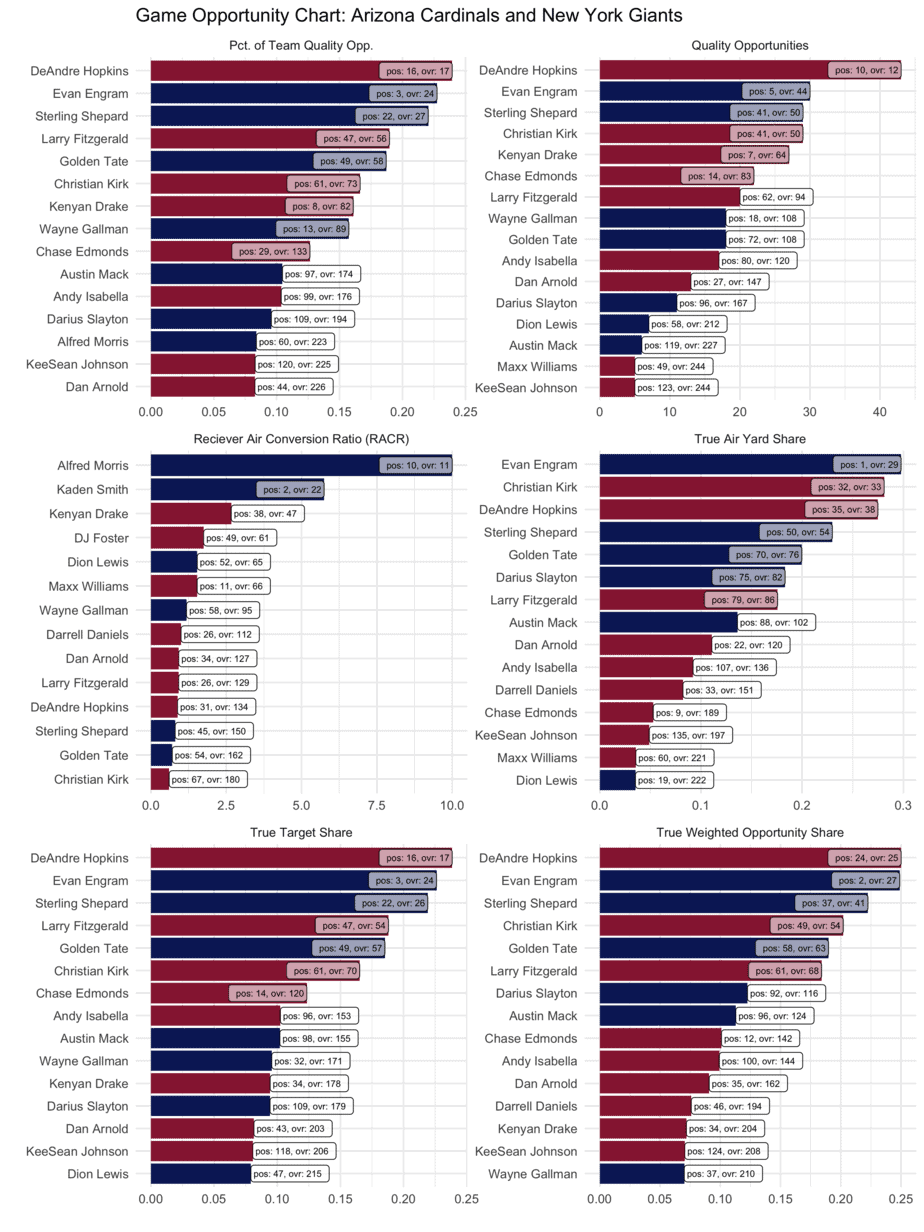
Skill Position Opportunities
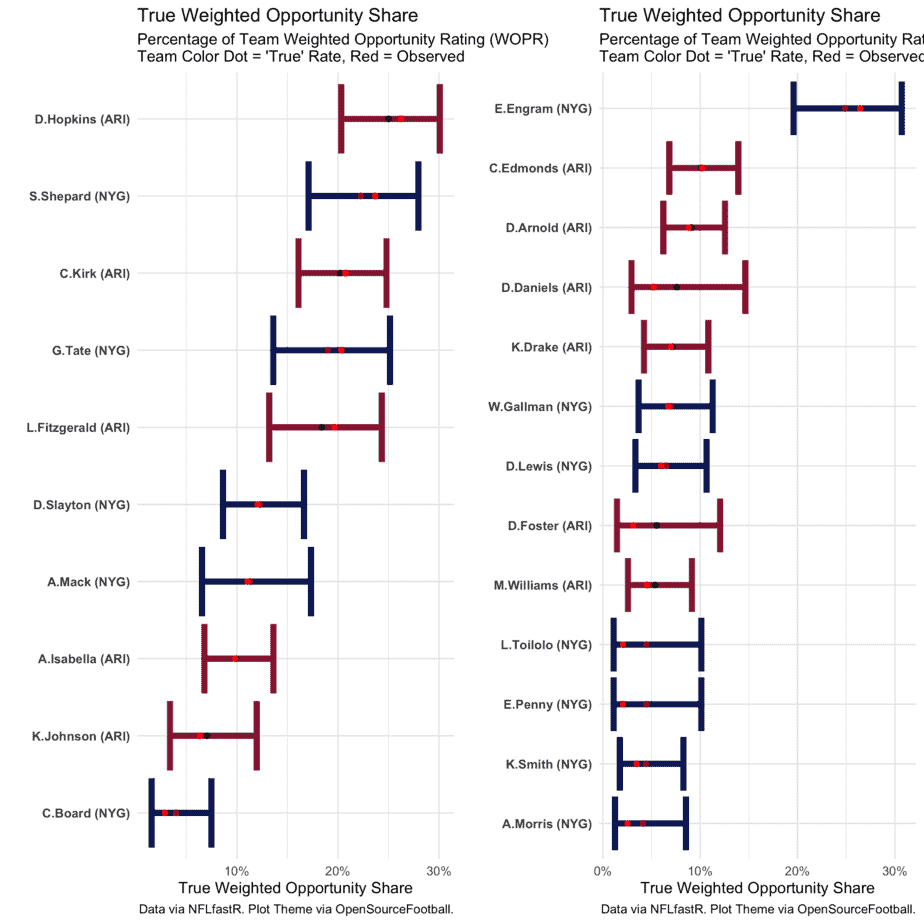
Range of Outcomes Analysis: Receiving Opportunity
Prediction: Cardinals 24, Giants 21
Looking for more NFL DFS picks and daily fantasy football matchups content? We have loads of articles, data and more on the Awesemo NFL home page. Just click HERE.
Denver Broncos (21.5) at Carolina Panthers (24)
All Graphs Reflect Last Five Weeks of Data, Click Graphs to Enlarge
Team Passing and Pace
Quarterback Play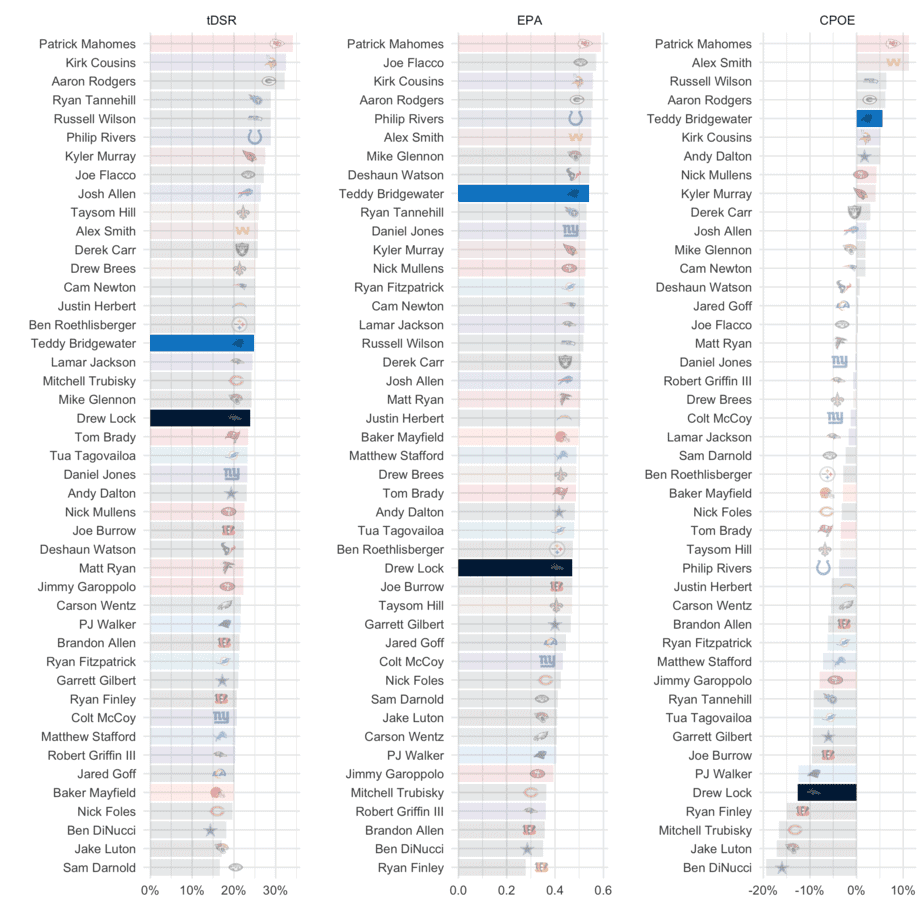
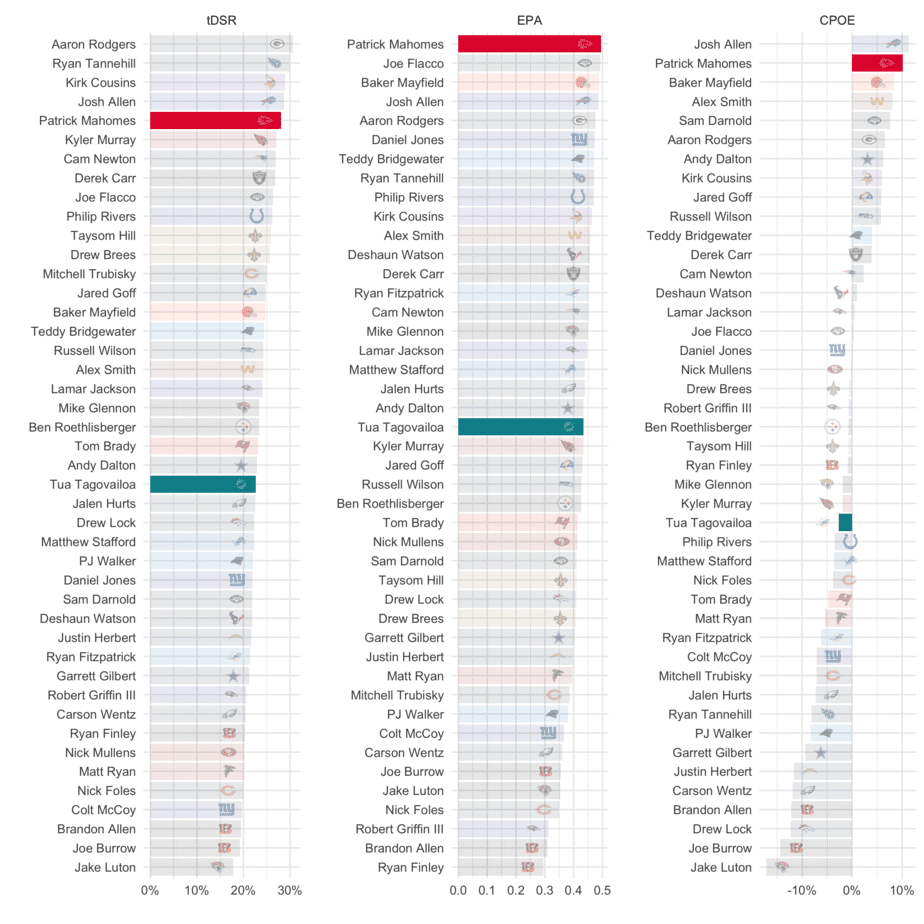
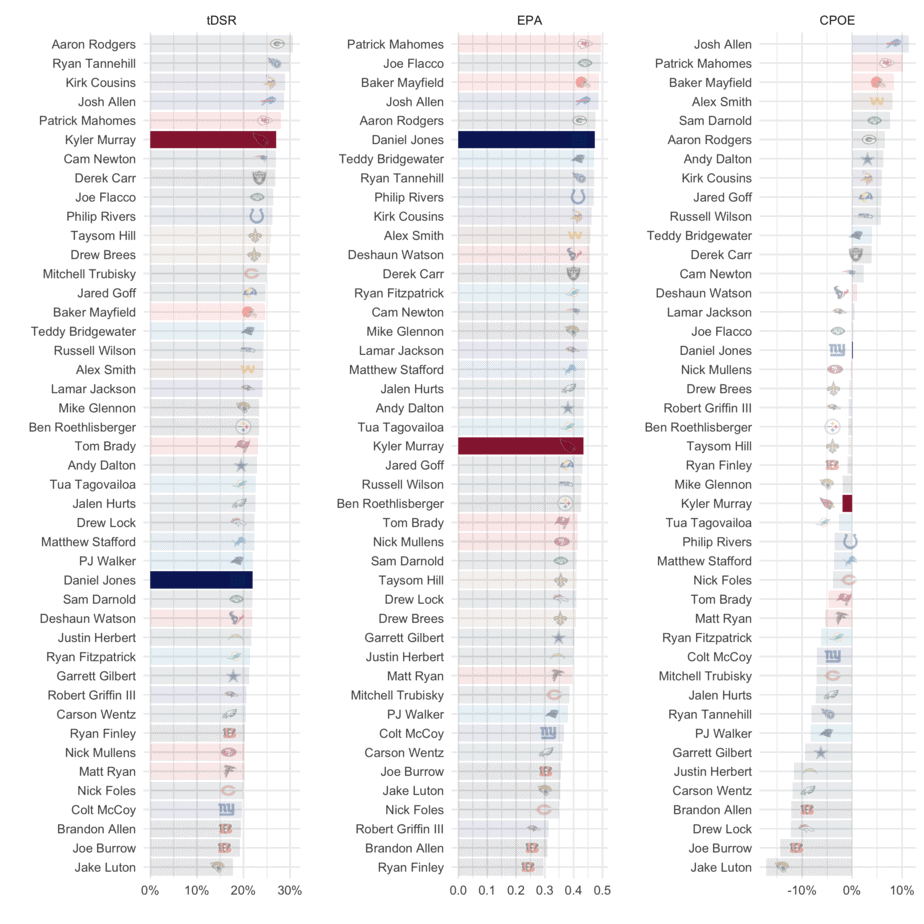
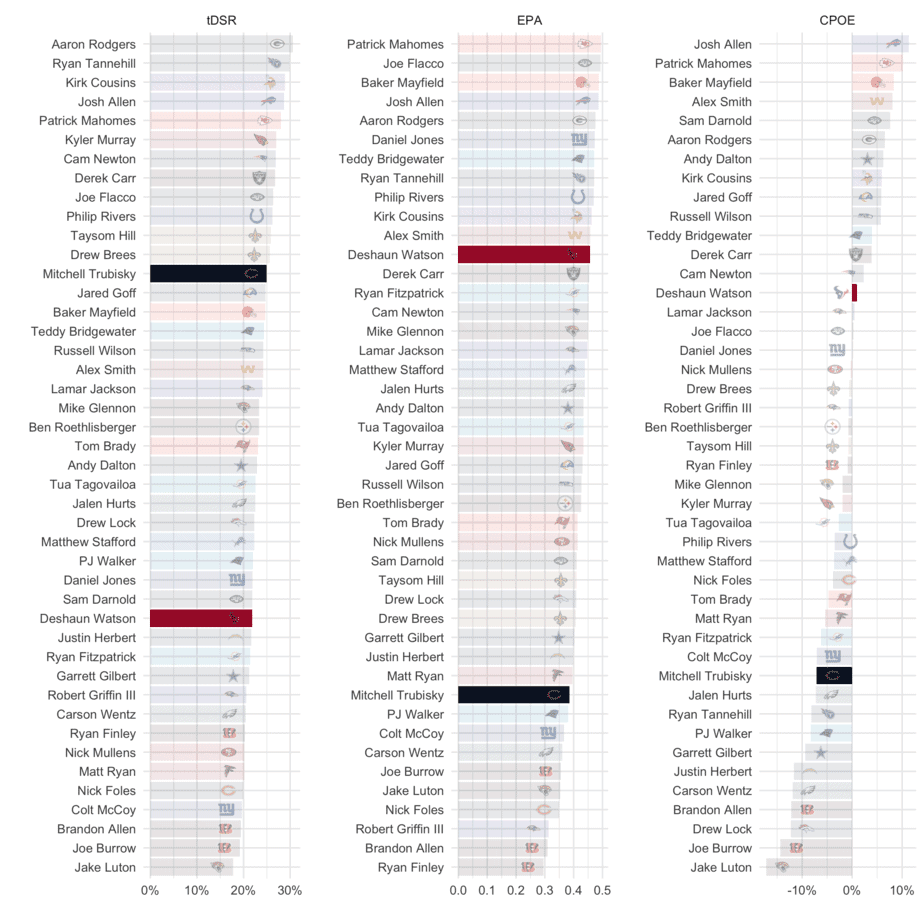
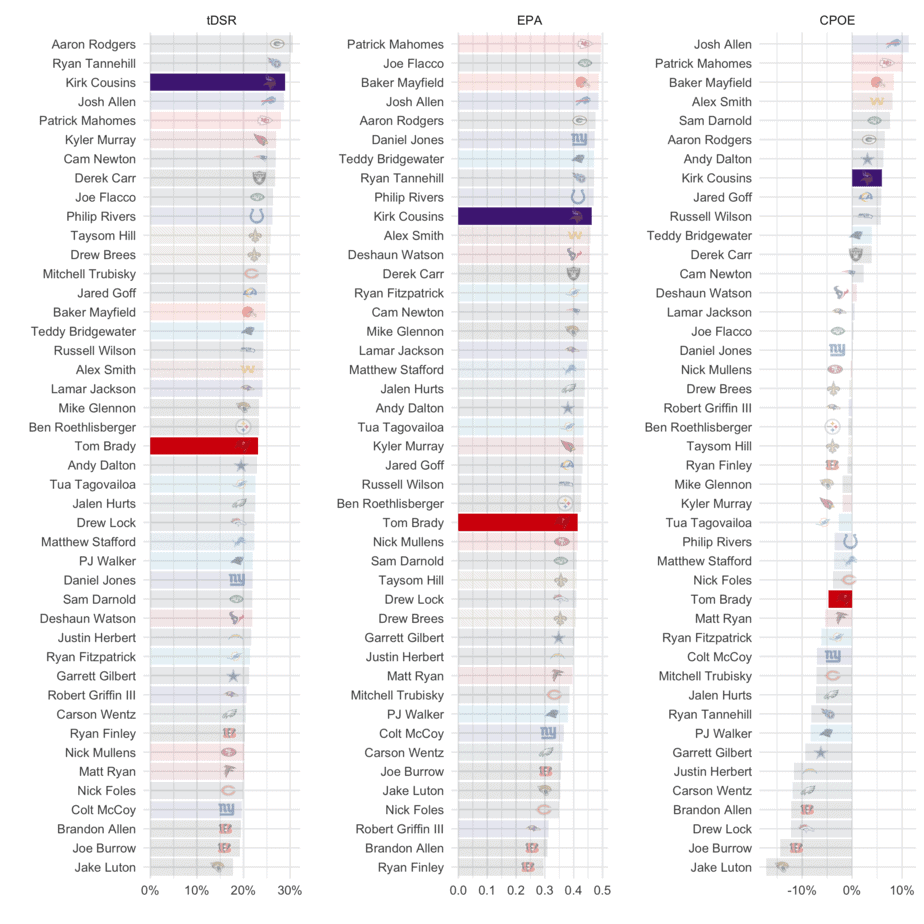
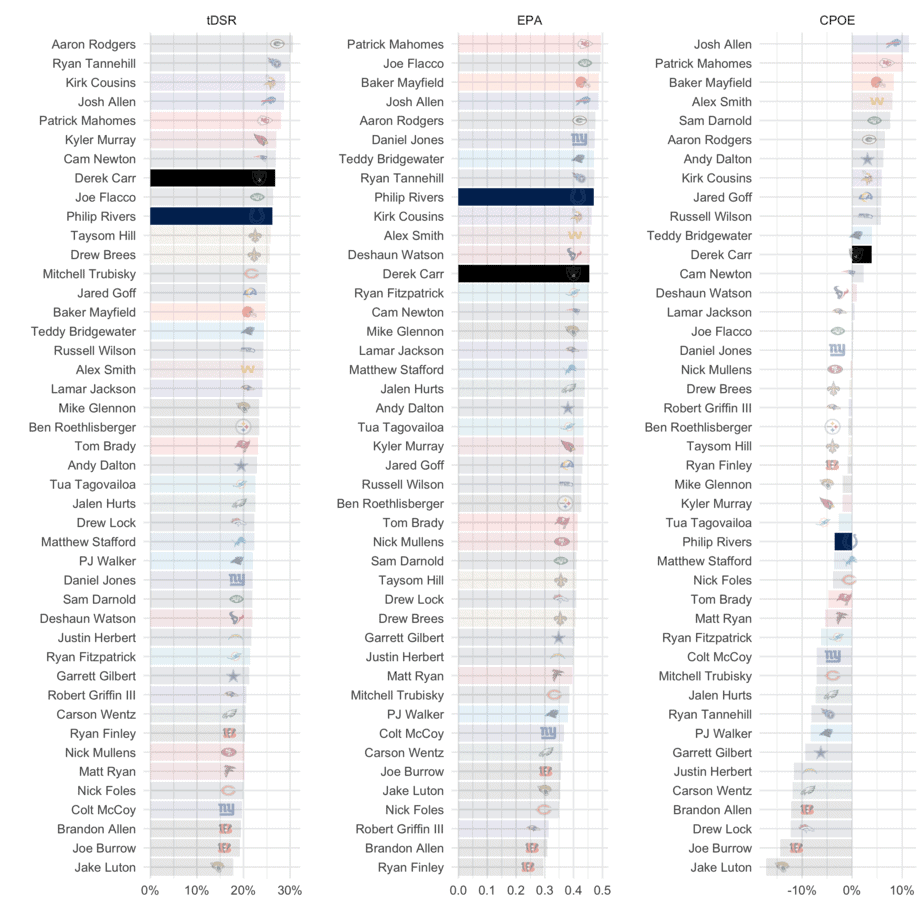
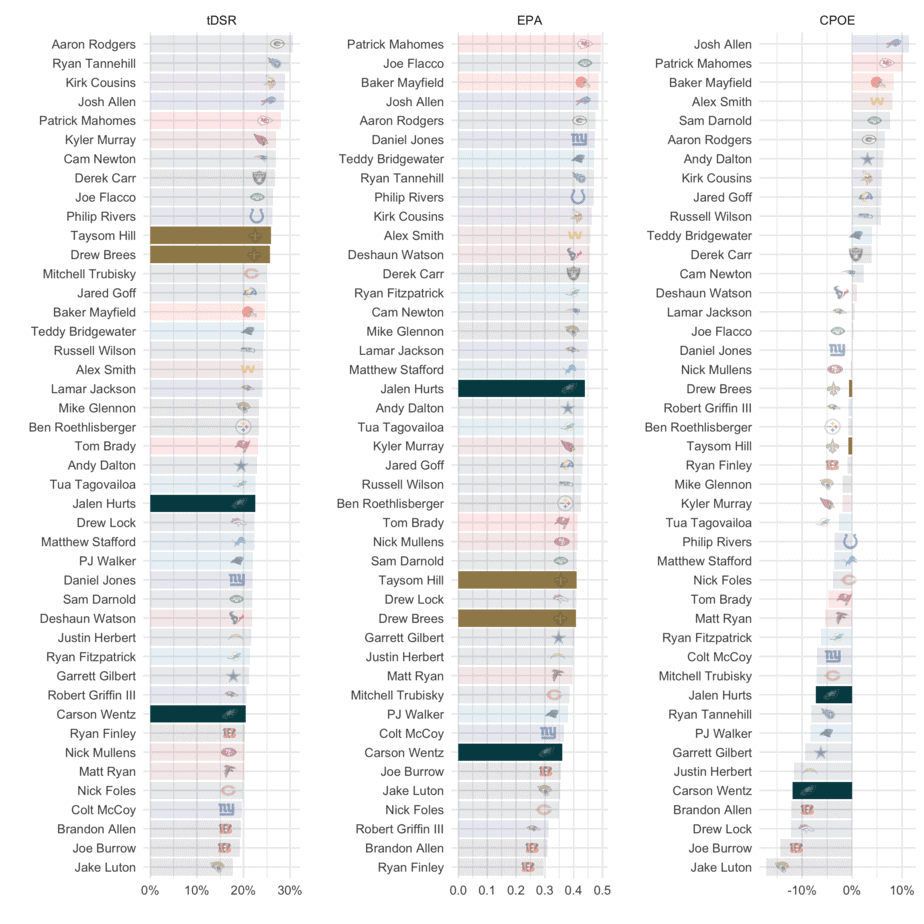
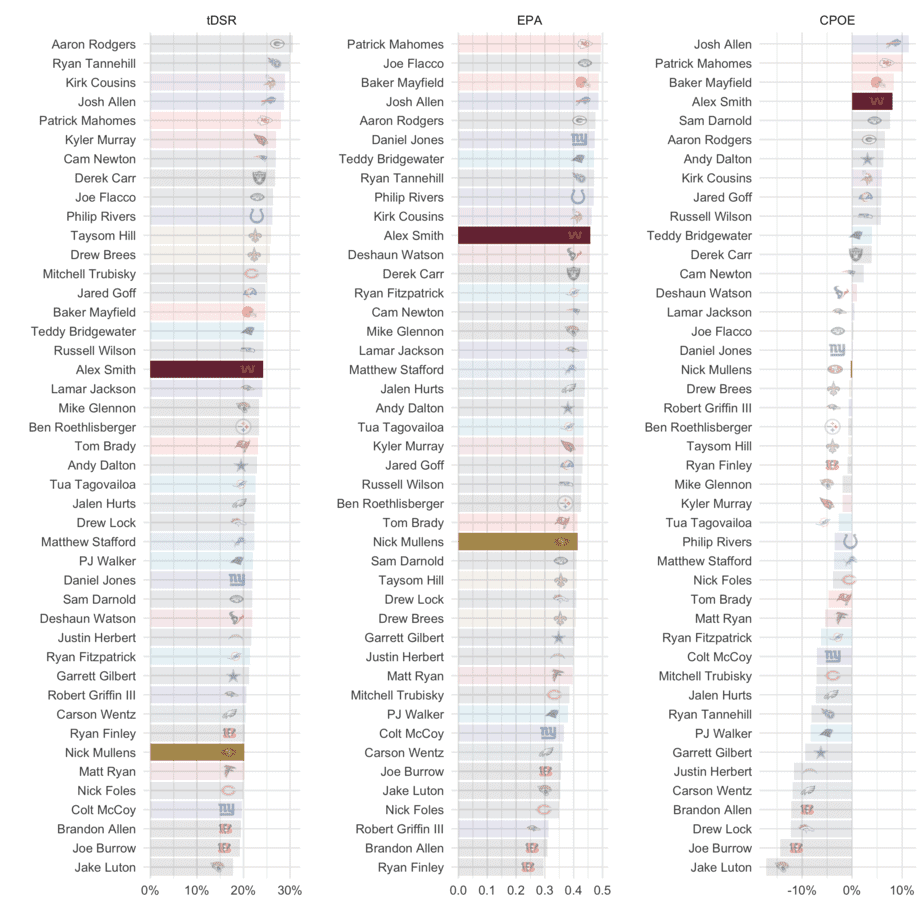
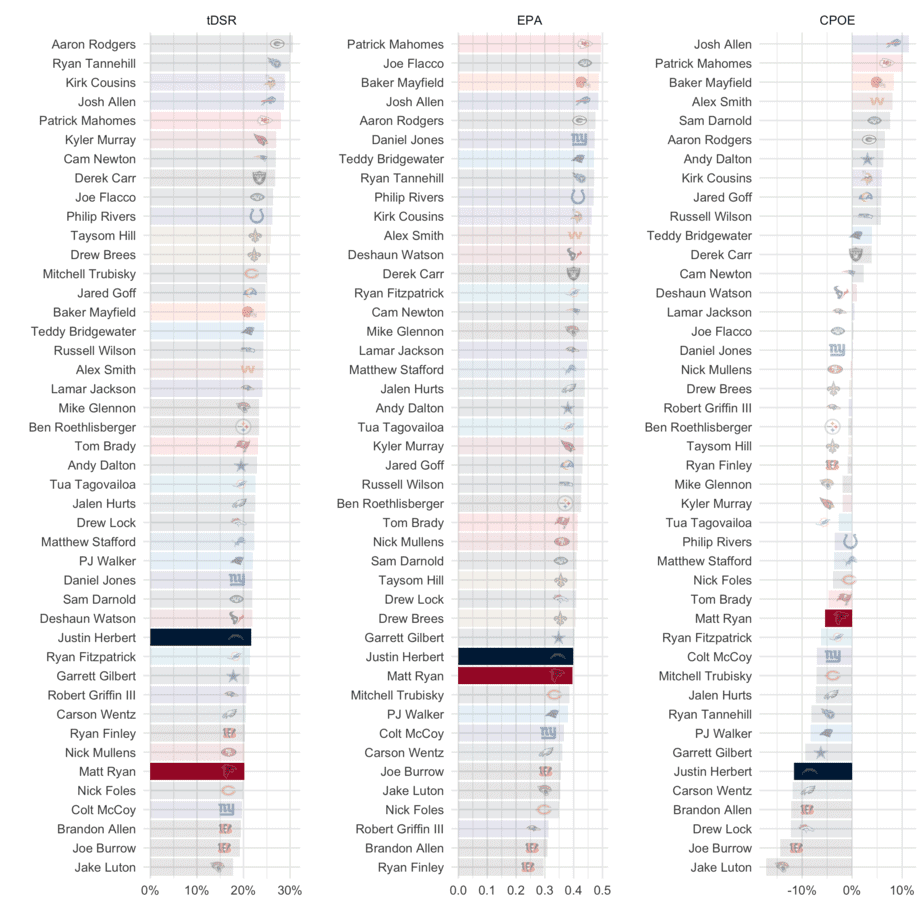
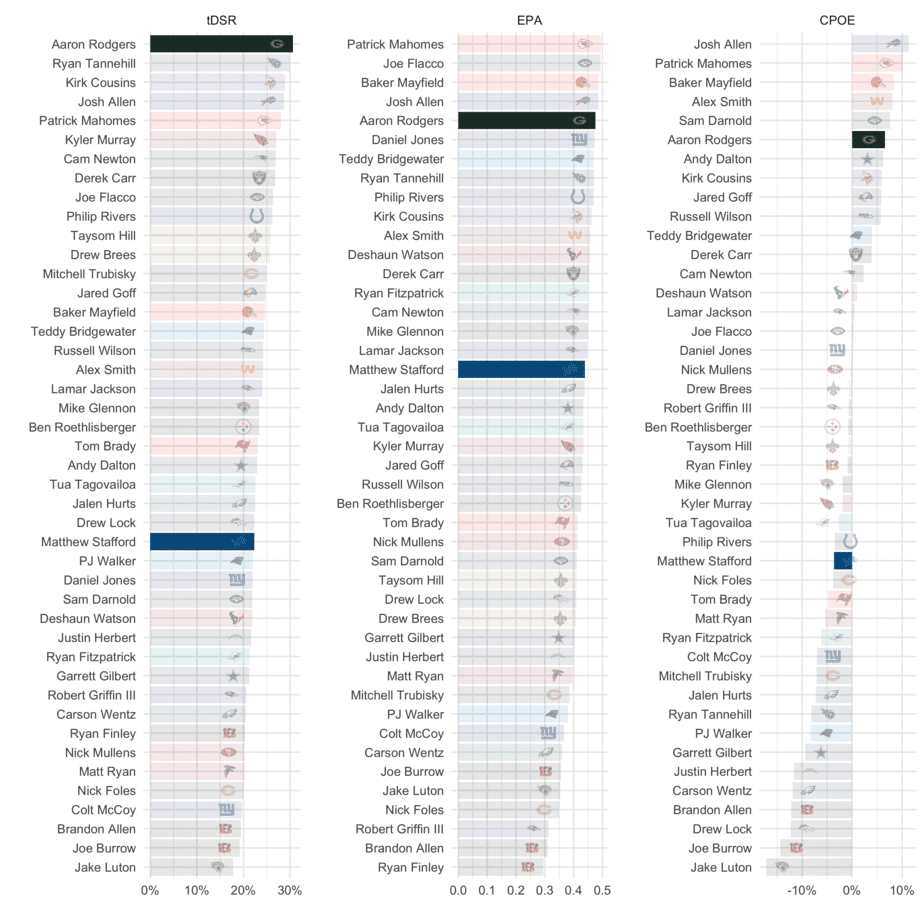
The three columns represent my three primary performance indicators for quarterbacks. Furthest left (tDSR) is True Drive Success Rate, a drive-based efficiency metric that measures a quarterback’s ability to turn drives into touchdowns, regressed based on sample size. The middle column, Expected Points Added (EPA), a metric that includes scrambles and designed rushes, is a measure of per-play efficiency. Finally, on the right is per-pass efficiency, Completion Percentage Over Expectation (CPOE) based on the publicly available completion percentage model included in the NFLFastR package.
NFL DFS Core Offenses
Let’s examine the primary skill players from each offense. For each player, their salary is compared to their fantasy points per game in column 2. Column 3 lists each player’s expected fantasy points (an excellent “catch-all” metric to measure usage) and fantasy points scored above or below expectation, a great proxy for efficiency. “DvP” measures the opposing defense’s fantasy points per game allowed above or below opponent averages. Finally, “xPROJ” combines a player’s expected fantasy points with their weekly matchup into one “expected projection” metric, which can be used to determine a player’s floor and ceiling.
Denver Broncos NFL DFS Picks
| Player | Salary and FPts/Gm | Expected FPts & FPts vs. Expected | DvP (Rk) / DvP, Last 5 (Rk) | xPROJ |
| Drew Lock, QB | $5100 (#21) / 13.5 FPts/Gm (#24) | 17.4 xFPTs/Gm (#18) / -3.9 FPvE (#31) | -3 FPA vs Avg (#3) / +1.7 FPA vs. Avg (#25) | 14.5 Fpts (QB18), +1 vs. Avg |
| Tim Patrick, WR | $4200 (#48) / 13.5 FPts/Gm (#34) | 11.9 xFPTs/Gm (#40) / +1.7 FPvE (#24) | +1.3 FPA vs Avg (#25) / -0.1 FPA vs. Avg (#17) | 12.5 Fpts (WR28), -1.1 vs. Avg |
| Jerry Jeudy, WR | $4700 (#40) / 6 FPts/Gm (#84) | 9.1 xFPTs/Gm (#59) / -3 FPvE (#125) | -2.7 FPA vs Avg (#8) / +3.1 FPA vs. Avg (#24) | 8 Fpts (WR54), +1.9 vs. Avg |
| Melvin Gordon III, RB | $5200 (#26) / 13 FPts/Gm (#18) | 12.8 xFPTs/Gm (#24) / +0.2 FPvE (#31) | +3.6 FPA vs Avg (#26) / -4.8 FPA vs. Avg (#6) | 15 Fpts (RB13), +2 vs. Avg |
| Noah Fant, TE | $4100 (#9) / 9.5 FPts/Gm (#8) | 9.6 xFPTs/Gm (#11) / +0.1 FPvE (#29) | -0.3 FPA vs Avg (#12) / +3.1 FPA vs. Avg (#28) | 9.5 Fpts (TE10), -0.2 vs. Avg |
| Phillip Lindsay, RB | $4300 (#45) / 5 FPts/Gm (#62) | 5.9 xFPTs/Gm (#58) / -1.1 FPvE (#65) | +3.6 FPA vs Avg (#26) / -4.8 FPA vs. Avg (#6) | 7.5 Fpts (RB38), +2.7 vs. Avg |
Carolina Panthers NFL DFS Picks
| Player | Salary and FPts/Gm | Expected FPts & FPts vs. Expected | DvP (Rk) / DvP, Last 5 (Rk) | xPROJ |
| Teddy Bridgewater, QB | $5800 (#13) / 18 FPts/Gm (#15) | 17.5 xFPTs/Gm (#16) / +0.7 FPvE (#11) | -0.6 FPA vs Avg (#15) / -4.8 FPA vs. Avg (#5) | 17 Fpts (QB13), -1.2 vs. Avg |
| Christian McCaffrey, RB | $9200 (#2) / 36 FPts/Gm (#1) | 30.1 xFPTs/Gm (#1) / +6.1 FPvE (#1) | +0.7 FPA vs Avg (#20) / +6.8 FPA vs. Avg (#29) | 30.5 Fpts (RB1), -5.7 vs. Avg |
| Robby Anderson, WR | $6200 (#19) / 15.5 FPts/Gm (#25) | 14.9 xFPTs/Gm (#23) / +0.4 FPvE (#54) | -1.8 FPA vs Avg (#8) / -1.6 FPA vs. Avg (#13) | 14 Fpts (WR22), -1.3 vs. Avg |
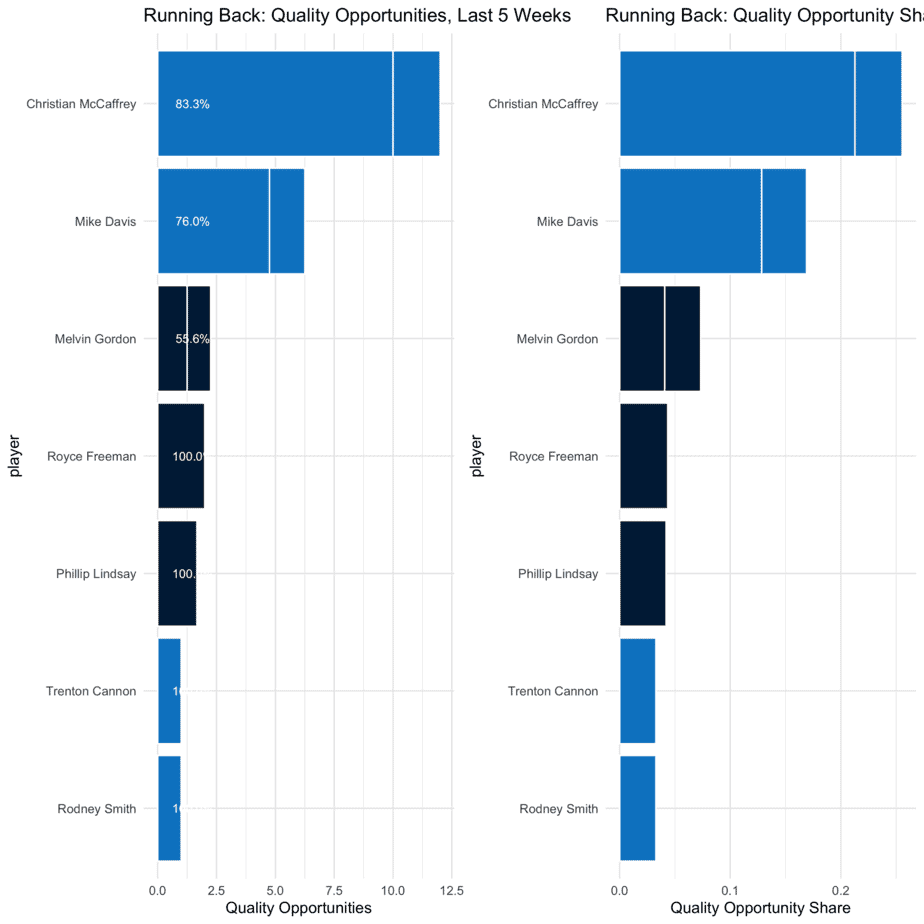
Running Back Quality Opportunities
Auxiliary Offenses
For lesser-utilized offensive players, let’s examine usage based on snap share, quality opportunity share and matchup. For each player, I categorize them as an NFL DFS value, a mass multi-entry option (MME-only) or a player to avoid altogether.
Denver Broncos NFL DFS Picks
| Player | Snap Share, Last 5 Weeks | True Quality Opp Share/True WOPR Share, Last 5 Weeks | DvP (Rk) / DvP, Last 5 (Rk) | Outlook: Value, MME-only, Look Elsewhere |
| K.J. Hamler, WR | 16% / 16% | -2.9 FPA vs Avg (#4) / +0.6 FPA vs. Avg (#18) | MME-Only | |
| Nick Vannett, TE | 35.5% | 6.5% / 5.3% | -0.3 FPA vs Avg (#12) / +3.1 FPA vs. Avg (#28) | Look Elsewhere |
| Royce Freeman, RB | 14.5% | 5.9% / 4.3% | +3.6 FPA vs Avg (#26) / -4.8 FPA vs. Avg (#6) | Look Elsewhere |
| DaeSean Hamilton, WR | 43.5% | 9.8% / 9.8% | -2.9 FPA vs Avg (#4) / +0.6 FPA vs. Avg (#18) | Look Elsewhere |
Carolina Panthers NFL DFS Picks
| Player | Snap Share, Last 5 Weeks | True Quality Opp Share/True WOPR Share, Last 5 Weeks | DvP (Rk) / DvP, Last 5 (Rk) | Outlook: Value, MME-only, Look Elsewhere |
| Brandon Zylstra, WR | 14.5% | 5.1% / 4.5% | -0.7 FPA vs Avg (#13) / -1.6 FPA vs. Avg (#7) | Look Elsewhere |
| Mike Davis, RB | 64.0% | 15.8% / 9.3% | +0.7 FPA vs Avg (#20) / +6.8 FPA vs. Avg (#29) | Look Elsewhere |
| Ian Thomas, TE | 66.5% | 6.1% / 5.3% | -2.5 FPA vs Avg (#7) / -6.6 FPA vs. Avg (#3) | Look Elsewhere |
| Chris Manhertz, TE | 45.0% | 5.4% / 4.4% | -2.5 FPA vs Avg (#7) / -6.6 FPA vs. Avg (#3) | Look Elsewhere |
| Pharoh Cooper, WR | 3.5% | 0% / 0% | -0.7 FPA vs Avg (#13) / -1.6 FPA vs. Avg (#7) | Look Elsewhere |
Skill Position Opportunities
Range of Outcomes Analysis: Receiving Opportunity
Prediction: Panthers 27, Broncos 20.
Looking for more NFL DFS picks and daily fantasy football matchups content? We have loads of articles, data and more on the Awesemo NFL home page. Just click HERE.
Houston Texans (23.5) at Chicago Bears (22)
All Graphs Reflect Last Five Weeks of Data, Click Graphs to Enlarge
Team Passing and Pace
Quarterback Play
NFL DFS Core Offenses
Let’s examine the primary skill players from each offense. For each player, their salary is compared to their fantasy points per game in column 2. Column 3 lists each player’s expected fantasy points (an excellent “catch-all” metric to measure usage) and fantasy points scored above or below expectation, a great proxy for efficiency. “DvP” measures the opposing defense’s fantasy points per game allowed above or below opponent averages. Finally, “xPROJ” combines a player’s expected fantasy points with their weekly matchup into one “expected projection” metric, which can be used to determine a player’s floor and ceiling.
Houston Texans NFL DFS Picks
| Player | Salary and FPts/Gm | Expected FPts & FPts vs. Expected | DvP (Rk) / DvP, Last 5 (Rk) | xPROJ |
| Deshaun Watson, QB | $7600 (#3) / 23.5 FPts/Gm (#6) | 21.7 xFPTs/Gm (#5) / +1.8 FPvE (#8) | -2.7 FPA vs Avg (#5) / -0.3 FPA vs. Avg (#14) | 19 Fpts (QB11), -4.5 vs. Avg |
| Brandin Cooks, WR | $6100 (#20) / 13 FPts/Gm (#37) | 12.8 xFPTs/Gm (#35) / +0.2 FPvE (#65) | -1.1 FPA vs Avg (#12) / +0.5 FPA vs. Avg (#20) | 12.5 Fpts (WR28), -0.5 vs. Avg |
| Keke Coutee, WR | $5000 (#32) / 10.5 FPts/Gm (#50) | 9.5 xFPTs/Gm (#55) / +0.9 FPvE (#39) | -4.8 FPA vs Avg (#2) / -6.3 FPA vs. Avg (#2) | 8 Fpts (WR54), -2.4 vs. Avg |
| David Johnson, RB | $5200 (#26) / 10 FPts/Gm (#31) | 11.9 xFPTs/Gm (#27) / -1.9 FPvE (#79) | -5.6 FPA vs Avg (#2) / -9.3 FPA vs. Avg (#3) | 8.5 Fpts (RB33), -1.5 vs. Avg |
Chicago Bears NFL DFS Picks
| Player | Salary and FPts/Gm | Expected FPts & FPts vs. Expected | DvP (Rk) / DvP, Last 5 (Rk) | xPROJ |
| Mitchell Trubisky, QB | $5600 (#16) / 14.5 FPts/Gm (#23) | 16.5 xFPTs/Gm (#20) / -1.8 FPvE (#28) | +0.7 FPA vs Avg (#20) / +2.8 FPA vs. Avg (#28) | 17 Fpts (QB13), +2.3 vs. Avg |
| Allen Robinson, WR | $6800 (#12) / 16.5 FPts/Gm (#21) | 16.4 xFPTs/Gm (#12) / +0 FPvE (#75) | +4.4 FPA vs Avg (#30) / +8.5 FPA vs. Avg (#32) | 18.5 Fpts (WR6), +2.1 vs. Avg |
| David Montgomery, RB | $6500 (#10) / 14 FPts/Gm (#15) | 14.8 xFPTs/Gm (#12) / -1 FPvE (#62) | +6.4 FPA vs Avg (#31) / +6.8 FPA vs. Avg (#29) | 19.5 Fpts (RB7), +5.7 vs. Avg |
Running Back Quality Opportunities
Auxiliary Offenses
For lesser-utilized offensive players, let’s examine usage based on snap share, quality opportunity share and matchup. For each player, I categorize them as an NFL DFS value, a mass multi-entry option (MME-only) or a player to avoid altogether.
Houston Texans NFL DFS Picks
| Player | Snap Share, Last 5 Weeks | True Quality Opp Share/True WOPR Share, Last 5 Weeks | DvP (Rk) / DvP, Last 5 (Rk) | Outlook: Value, MME-only, Look Elsewhere |
| Chad Hansen, WR | 92.0% | 16.1% / 19.3% | -3.4 FPA vs Avg (#2) / -2 FPA vs. Avg (#6) | Value |
| Jordan Akins, TE | 49.0% | 10.5% / 10.6% | +1.6 FPA vs Avg (#25) / +2.1 FPA vs. Avg (#26) | Value |
| Duke Johnson, RB | 60.5% | 12.6% / 9.4% | -5.6 FPA vs Avg (#2) / -9.3 FPA vs. Avg (#3) | MME-Only |
| Darren Fells, TE | 58.5% | 8.2% / 7.1% | +1.6 FPA vs Avg (#25) / +2.1 FPA vs. Avg (#26) | Look Elsewhere |
| Pharaoh Brown, TE | 35.0% | 6.9% / 6.9% | +1.6 FPA vs Avg (#25) / +2.1 FPA vs. Avg (#26) | Look Elsewhere |
Chicago Bears NFL DFS Picks
| Player | Snap Share, Last 5 Weeks | True Quality Opp Share/True WOPR Share, Last 5 Weeks | DvP (Rk) / DvP, Last 5 (Rk) | Outlook: Value, MME-only, Look Elsewhere |
| Darnell Mooney, WR | 82.5% | 17% / 20.9% | -2.1 FPA vs Avg (#10) / -3.7 FPA vs. Avg (#7) | MME-Only |
| Anthony Miller, WR | 66.0% | 16.3% / 16.8% | +1 FPA vs Avg (#24) / +4.7 FPA vs. Avg (#30) | MME-Only |
| Cole Kmet, TE | 52.5% | 8.5% / 7.9% | +0.1 FPA vs Avg (#16) / +1.3 FPA vs. Avg (#22) | Look Elsewhere |
| Cordarrelle Patterson, RB | 19.0% | 7.9% / 5.7% | +6.4 FPA vs Avg (#31) / +6.8 FPA vs. Avg (#29) | MME-Only |
| Jimmy Graham, TE | 59.5% | 12.6% / 11.8% | +0.1 FPA vs Avg (#16) / +1.3 FPA vs. Avg (#22) | MME-Only |
| Javon Wims, WR | 25.5% | 5% / 5.4% | +1 FPA vs Avg (#24) / +4.7 FPA vs. Avg (#30) | Look Elsewhere |
| Ryan Nall, RB | 4.5% | 5.8% / 4.3% | +6.4 FPA vs Avg (#31) / +6.8 FPA vs. Avg (#29) | Look Elsewhere |
Skill Position Opportunities
Range of Outcomes Analysis: Receiving Opportunity
Prediction: Texans 27, Bears 26
Looking for more NFL DFS picks and daily fantasy football matchups content? We have loads of articles, data and more on the Awesemo NFL home page. Just click HERE.
Dallas Cowboys (23.5) at Cincinnati Bengals (20)
All Graphs Reflect Last Five Weeks of Data, Click Graphs to Enlarge
Team Passing and Pace
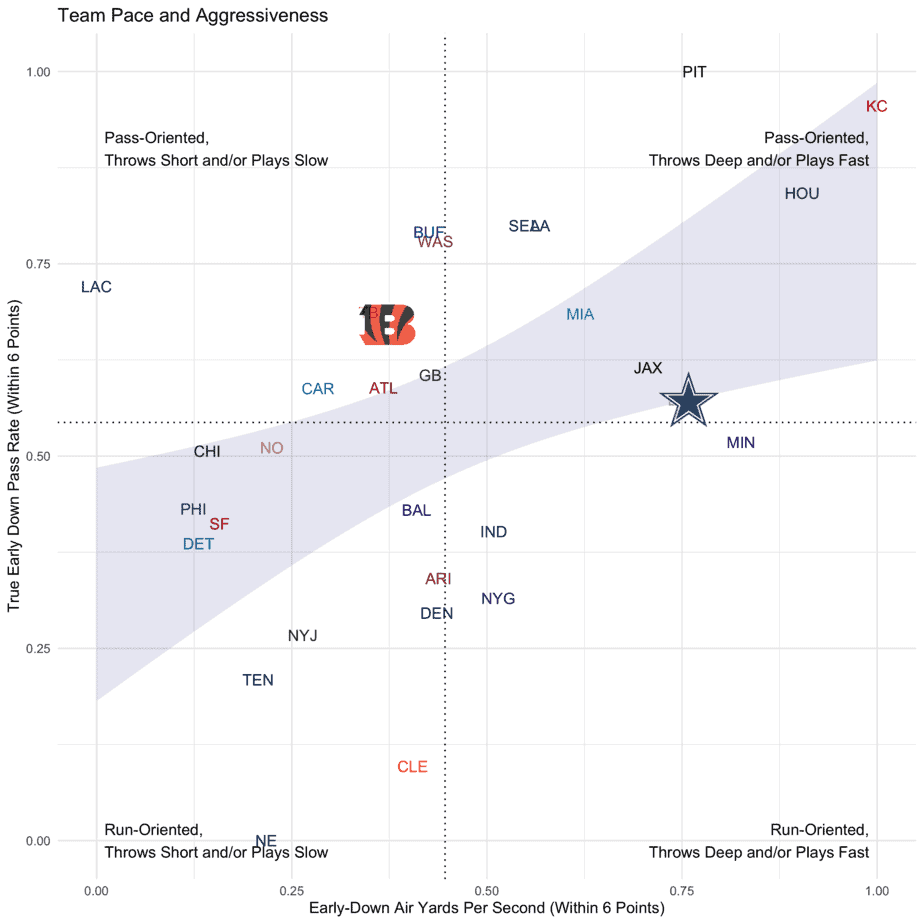
Quarterback Play
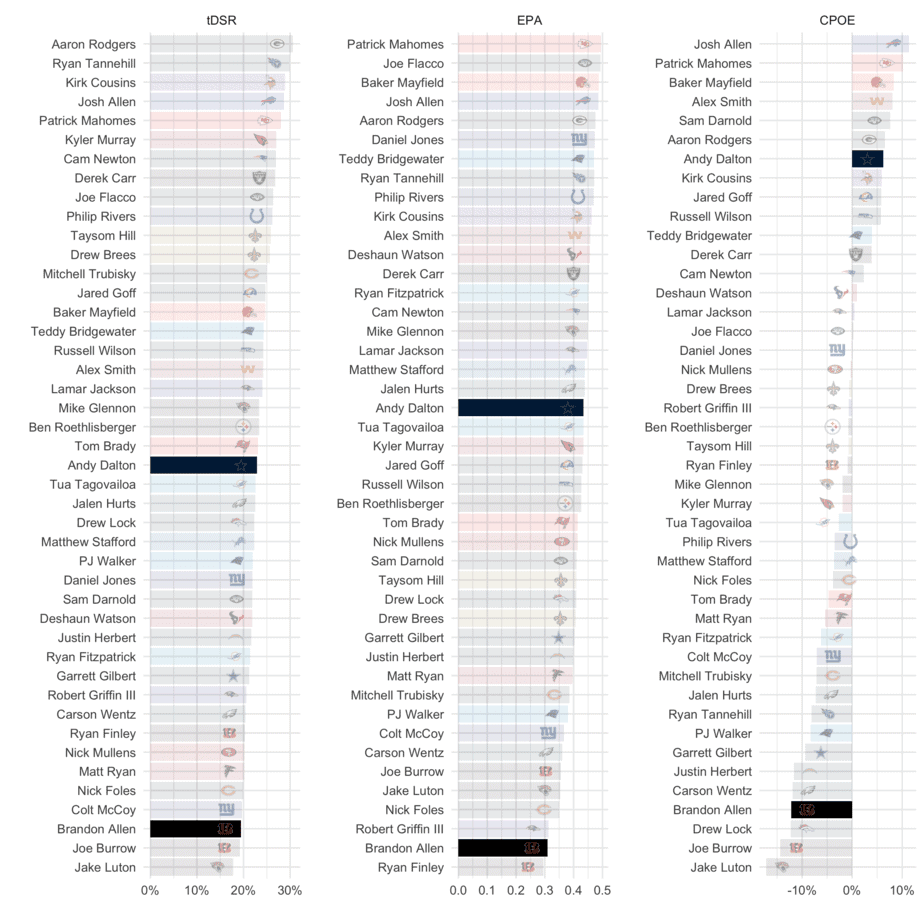
The three columns represent my three primary performance indicators for quarterbacks. Furthest left (tDSR) is True Drive Success Rate, a drive-based efficiency metric that measures a quarterback’s ability to turn drives into touchdowns, regressed based on sample size. The middle column, Expected Points Added (EPA), a metric that includes scrambles and designed rushes, is a measure of per-play efficiency. Finally, on the right is per-pass efficiency, Completion Percentage Over Expectation (CPOE) based on the publicly available completion percentage model included in the NFLFastR package.
NFL DFS Core Offenses
Let’s examine the primary skill players from each offense. For each player, their salary is compared to their fantasy points per game in column 2. Column 3 lists each player’s expected fantasy points (an excellent “catch-all” metric to measure usage) and fantasy points scored above or below expectation, a great proxy for efficiency. “DvP” measures the opposing defense’s fantasy points per game allowed above or below opponent averages. Finally, “xPROJ” combines a player’s expected fantasy points with their weekly matchup into one “expected projection” metric, which can be used to determine a player’s floor and ceiling.
Dallas Cowboys NFL DFS Picks
| Player | Salary and FPts/Gm | Expected FPts & FPts vs. Expected | DvP (Rk) / DvP, Last 5 (Rk) | xPROJ |
| Andy Dalton, QB | $5500 (#17) / 10.5 FPts/Gm (#29) | 10.7 xFPTs/Gm (#29) / -0.3 FPvE (#20) | +2.3 FPA vs Avg (#28) / +6.4 FPA vs. Avg (#32) | 13 Fpts (QB21), +2.6 vs. Avg |
| Ezekiel Elliott, RB | $6600 (#9) / 14.5 FPts/Gm (#13) | 15.9 xFPTs/Gm (#11) / -1.6 FPvE (#73) | -1.2 FPA vs Avg (#13) / -4.1 FPA vs. Avg (#10) | 15 Fpts (RB13), +0.7 vs. Avg |
| Amari Cooper, WR | $6500 (#16) / 18 FPts/Gm (#16) | 15.9 xFPTs/Gm (#15) / +2 FPvE (#18) | -0.1 FPA vs Avg (#19) / -0.6 FPA vs. Avg (#15) | 16 Fpts (WR16), -1.9 vs. Avg |
| CeeDee Lamb, WR | $4800 (#38) / 14 FPts/Gm (#32) | 13.1 xFPTs/Gm (#34) / +0.7 FPvE (#44) | +5.6 FPA vs Avg (#32) / +8.1 FPA vs. Avg (#28) | 15 Fpts (WR19), +1.2 vs. Avg |
Cincinnati Bengals NFL DFS Picks
| Player | Salary and FPts/Gm | Expected FPts & FPts vs. Expected | DvP (Rk) / DvP, Last 5 (Rk) | xPROJ |
| Brandon Allen, QB | $4900 (#26) / 9.5 FPts/Gm (#30) | 9.8 xFPTs/Gm (#30) / -0.4 FPvE (#21) | +2.1 FPA vs Avg (#27) / +1.6 FPA vs. Avg (#24) | 12 Fpts (QB22), +2.6 vs. Avg |
| Joe Mixon, RB | $5900 (#17) / 15.5 FPts/Gm (#11) | 16.9 xFPTs/Gm (#9) / -1.2 FPvE (#69) | -0.4 FPA vs Avg (#15) / -1.7 FPA vs. Avg (#16) | 16.5 Fpts (RB10), +0.8 vs. Avg |
| Tyler Boyd, WR | $4900 (#35) / 15 FPts/Gm (#28) | 15 xFPTs/Gm (#21) / +0.2 FPvE (#65) | +9.2 FPA vs Avg (#32) / +6.5 FPA vs. Avg (#31) | 18 Fpts (WR8), +2.8 vs. Avg |
| Tee Higgins, WR | $4800 (#38) / 13.5 FPts/Gm (#34) | 13.2 xFPTs/Gm (#32) / +0.4 FPvE (#54) | +9.2 FPA vs Avg (#32) / +6.5 FPA vs. Avg (#31) | 16.5 Fpts (WR13), +2.9 vs. Avg |
| A.J. Green, WR | $3000 (#80) / 1.5 FPts/Gm (#119) | 6.4 xFPTs/Gm (#86) / -4.9 FPvE (#126) | -3.7 FPA vs Avg (#1) / -3.1 FPA vs. Avg (#4) | 5.5 Fpts (WR74), +4 vs. Avg |
| Giovani Bernard, RB | $5000 (#30) / 8 FPts/Gm (#44) | 9.3 xFPTs/Gm (#39) / -1.4 FPvE (#72) | -0.4 FPA vs Avg (#15) / -1.7 FPA vs. Avg (#16) | 9 Fpts (RB31), +1.1 vs. Avg |
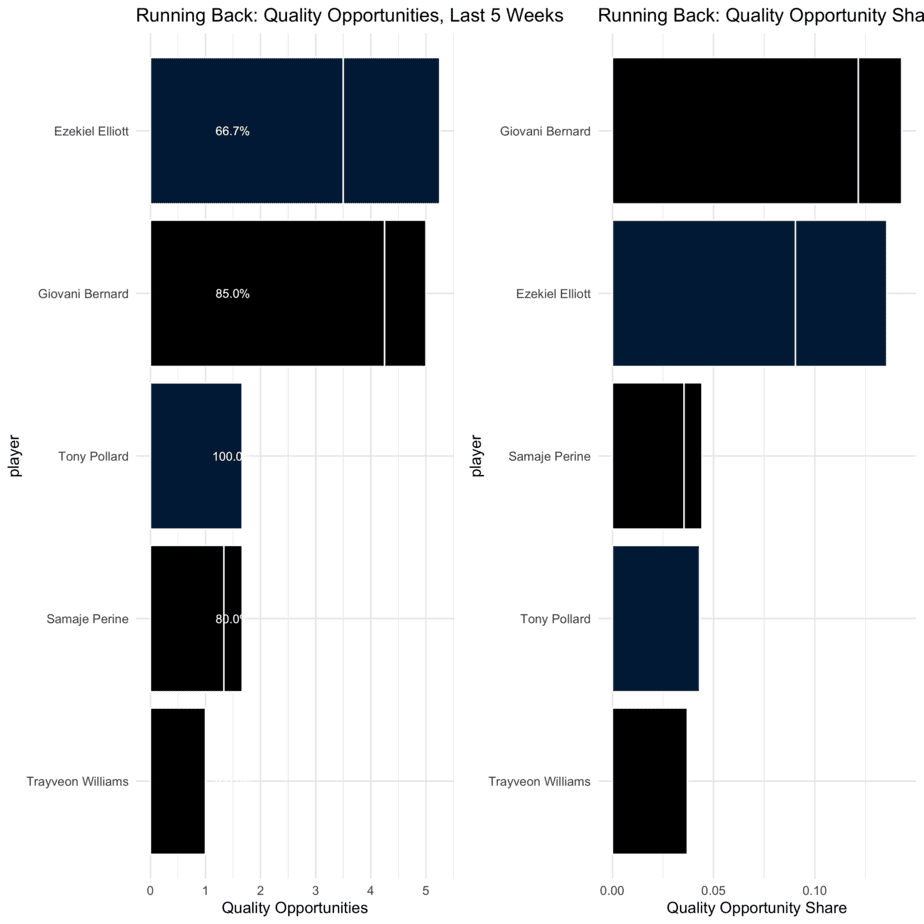
Running Back Quality Opportunities
Auxiliary Offenses
For lesser-utilized offensive players, let’s examine usage based on snap share, quality opportunity share and matchup. For each player, I categorize them as an NFL DFS value, a mass multi-entry option (MME-only) or a player to avoid altogether.
Dallas Cowboys NFL DFS Picks
| Player | Snap Share, Last 5 Weeks | True Quality Opp Share/True WOPR Share, Last 5 Weeks | DvP (Rk) / DvP, Last 5 (Rk) | Outlook: Value, MME-only, Look Elsewhere |
| Tony Pollard, RB | 33.0% | 5.9% / 4.3% | -1.2 FPA vs Avg (#13) / -4.1 FPA vs. Avg (#10) | MME-Only |
| Dalton Schultz, TE | 88.5% | 14.8% / 14.2% | +1.4 FPA vs Avg (#24) / +3.3 FPA vs. Avg (#29) | Value |
| Michael Gallup, WR | 87.0% | 19.1% / 21.1% | +2.4 FPA vs Avg (#29) / +6.6 FPA vs. Avg (#32) | Value |
| Noah Brown, WR | 20.0% | 5.7% / 5.8% | +2.4 FPA vs Avg (#29) / +6.6 FPA vs. Avg (#32) | Look Elsewhere |
| Cedrick Wilson, WR | 7% / 7.5% | +2.4 FPA vs Avg (#29) / +6.6 FPA vs. Avg (#32) | Look Elsewhere |
Cincinnati Bengals NFL DFS Picks
| Player | Snap Share, Last 5 Weeks | True Quality Opp Share/True WOPR Share, Last 5 Weeks | DvP (Rk) / DvP, Last 5 (Rk) | Outlook: Value, MME-only, Look Elsewhere |
| Drew Sample, TE | 82.5% | 10.3% / 8.8% | +1.2 FPA vs Avg (#23) / -2.5 FPA vs. Avg (#8) | Look Elsewhere |
| Alex Erickson, WR | 9.5% | 5.9% / 4.8% | -3.7 FPA vs Avg (#1) / -3.1 FPA vs. Avg (#4) | Look Elsewhere |
| Mike Thomas, WR | 24.0% | 7.3% / 7.7% | -3.7 FPA vs Avg (#1) / -3.1 FPA vs. Avg (#4) | Look Elsewhere |
| Cethan Carter, TE | 25.0% | 4.6% / 3.4% | +1.2 FPA vs Avg (#23) / -2.5 FPA vs. Avg (#8) | Look Elsewhere |
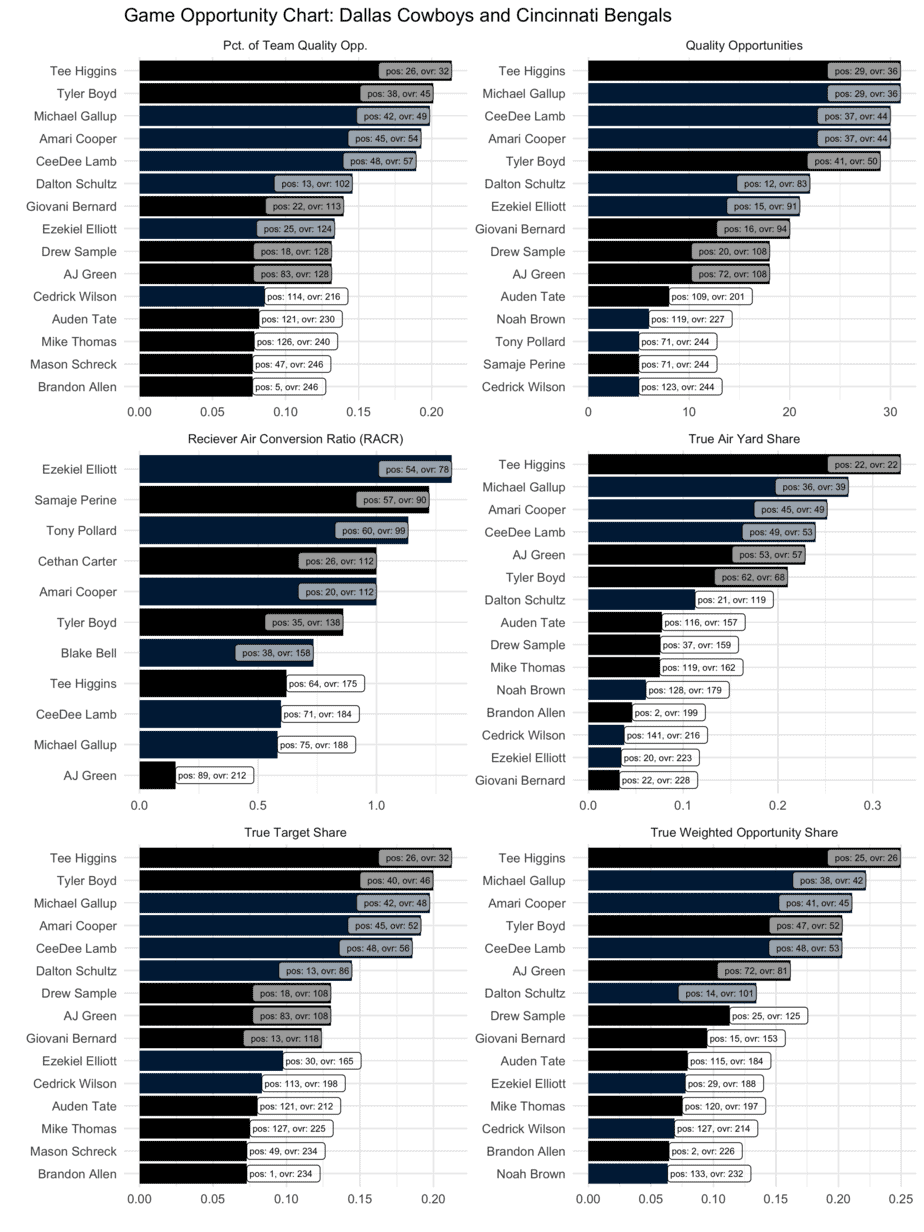
Skill Position Opportunities
Range of Outcomes Analysis: Receiving Opportunity
Prediction: Cowboys 27, Bengals 14
Looking for more NFL DFS picks and daily fantasy football matchups content? We have loads of articles, data and more on the Awesemo NFL home page. Just click HERE.
Minnesota Vikings (23) at Tampa Bay Buccaneers (29.5)
All Graphs Reflect Last Five Weeks of Data, Click Graphs to Enlarge
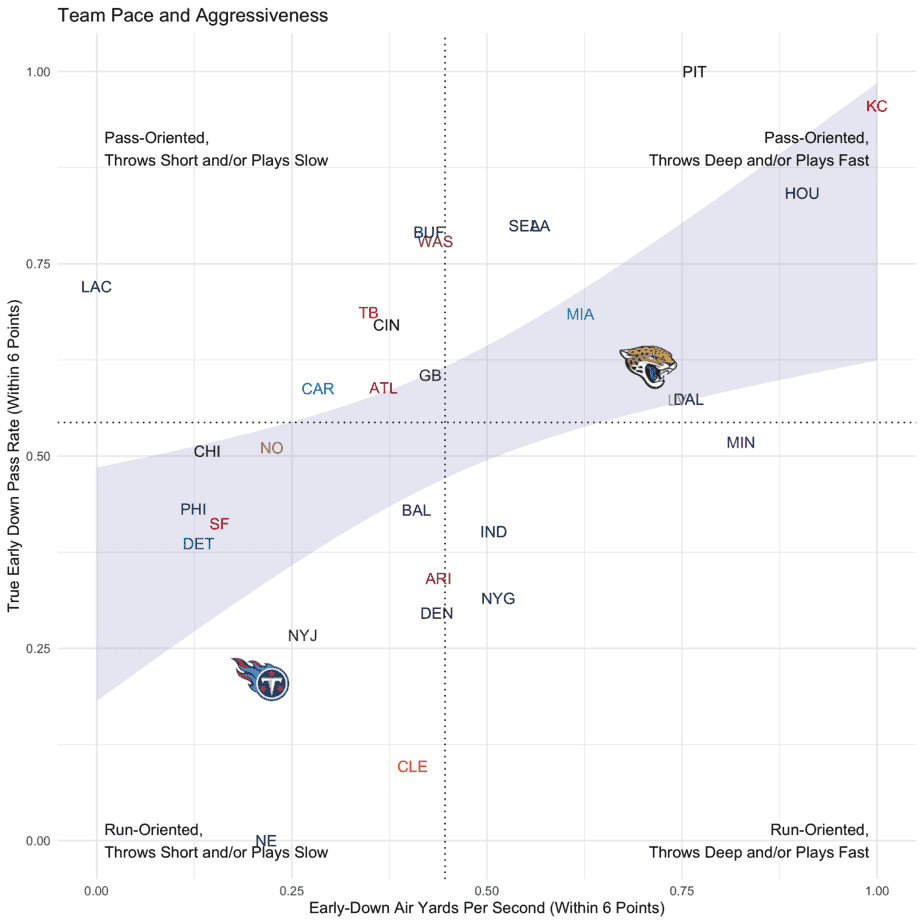
Team Passing and Pace
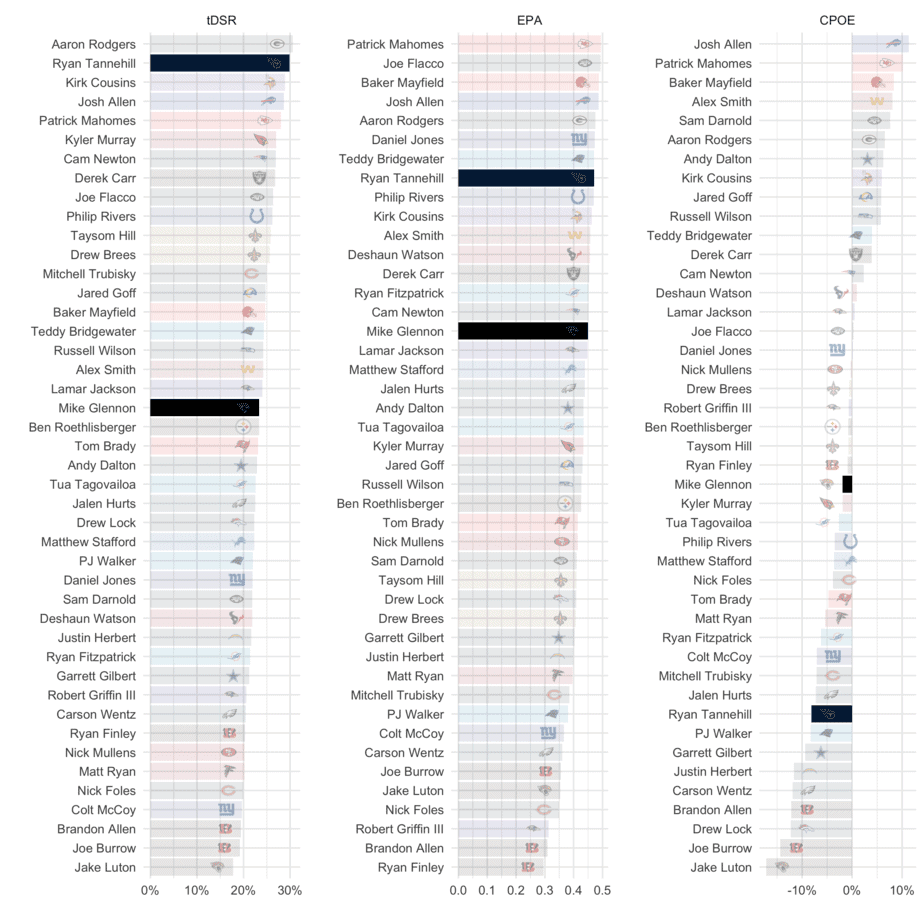
Quarterback Play
NFL DFS Core Offenses
Let’s examine the primary skill players from each offense. For each player, their salary is compared to their fantasy points per game in column 2. Column 3 lists each player’s expected fantasy points (an excellent “catch-all” metric to measure usage) and fantasy points scored above or below expectation, a great proxy for efficiency. “DvP” measures the opposing defense’s fantasy points per game allowed above or below opponent averages. Finally, “xPROJ” combines a player’s expected fantasy points with their weekly matchup into one “expected projection” metric, which can be used to determine a player’s floor and ceiling.
Minnesota Vikings NFL DFS Picks
| Player | Salary and FPts/Gm | Expected FPts & FPts vs. Expected | DvP (Rk) / DvP, Last 5 (Rk) | xPROJ |
| Kirk Cousins, QB | $6200 (#10) / 18.5 FPts/Gm (#12) | 15.8 xFPTs/Gm (#22) / +2.9 FPvE (#5) | -1.6 FPA vs Avg (#7) / +5.1 FPA vs. Avg (#31) | 14 Fpts (QB19), -4.7 vs. Avg |
| Dalvin Cook, RB | $9400 (#1) / 29 FPts/Gm (#2) | 25 xFPTs/Gm (#2) / +4 FPvE (#3) | -5.3 FPA vs Avg (#3) / -8.3 FPA vs. Avg (#4) | 21 Fpts (RB6), -8 vs. Avg |
| Justin Jefferson, WR | $7400 (#7) / 22 FPts/Gm (#4) | 17.3 xFPTs/Gm (#9) / +4.6 FPvE (#2) | -0.6 FPA vs Avg (#17) / +1.2 FPA vs. Avg (#23) | 17 Fpts (WR12), -4.9 vs. Avg |
| Adam Thielen, WR | $7000 (#11) / 21 FPts/Gm (#5) | 18.4 xFPTs/Gm (#5) / +2.6 FPvE (#10) | +1.1 FPA vs Avg (#20) / +5 FPA vs. Avg (#26) | 19 Fpts (WR5), -2 vs. Avg |
| Kyle Rudolph, TE | $2900 (#28) / 6 FPts/Gm (#27) | 5.6 xFPTs/Gm (#28) / +0.4 FPvE (#17) | +0.9 FPA vs Avg (#21) / +4.6 FPA vs. Avg (#31) | 6 Fpts (TE25), 0 vs. Avg |
Tampa Bay Buccaneers NFL DFS Picks
| Player | Salary and FPts/Gm | Expected FPts & FPts vs. Expected | DvP (Rk) / DvP, Last 5 (Rk) | xPROJ |
| Tom Brady, QB | $6900 (#6) / 21 FPts/Gm (#9) | 21.1 xFPTs/Gm (#6) / -0.2 FPvE (#19) | -1 FPA vs Avg (#13) / -0.4 FPA vs. Avg (#13) | 20 Fpts (QB7), -0.9 vs. Avg |
| Chris Godwin, WR | $6300 (#18) / 17.5 FPts/Gm (#17) | 15.4 xFPTs/Gm (#18) / +2.1 FPvE (#16) | +3.3 FPA vs Avg (#28) / -0.6 FPA vs. Avg (#15) | 16.5 Fpts (WR13), -1 vs. Avg |
| Ronald Jones, RB | $6100 (#15) / 13 FPts/Gm (#17) | 13.4 xFPTs/Gm (#20) / -0.3 FPvE (#44) | -0.3 FPA vs Avg (#16) / -1.3 FPA vs. Avg (#19) | 13 Fpts (RB21), -0.1 vs. Avg |
| Mike Evans, WR | $6600 (#14) / 15.5 FPts/Gm (#24) | 14.6 xFPTs/Gm (#25) / +0.9 FPvE (#39) | -0.6 FPA vs Avg (#13) / +2.4 FPA vs. Avg (#21) | 14.5 Fpts (WR20), -1 vs. Avg |
| Antonio Brown, WR | $5500 (#25) / 6.5 FPts/Gm (#79) | 9.2 xFPTs/Gm (#58) / -2.6 FPvE (#122) | -1.3 FPA vs Avg (#8) / -0.9 FPA vs. Avg (#10) | 9 Fpts (WR47), +2.4 vs. Avg |
| Leonard Fournette, RB | $4500 (#40) / 7.5 FPts/Gm (#46) | 9 xFPTs/Gm (#41) / -1.6 FPvE (#73) | -0.3 FPA vs Avg (#16) / -1.3 FPA vs. Avg (#19) | 9 Fpts (RB31), +1.6 vs. Avg |
| Rob Gronkowski, TE | $4800 (#4) / 8.5 FPts/Gm (#16) | 9.3 xFPTs/Gm (#14) / -0.7 FPvE (#53) | -1.9 FPA vs Avg (#8) / +0.9 FPA vs. Avg (#21) | 8 Fpts (TE17), -0.6 vs. Avg |
Running Back Quality Opportunities
Auxiliary Offenses
For lesser-utilized offensive players, let’s examine usage based on snap share, quality opportunity share and matchup. For each player, I categorize them as an NFL DFS value, a mass multi-entry option (MME-only) or a player to avoid altogether.
Minnesota Vikings NFL DFS Picks
| Player | Snap Share, Last 5 Weeks | True Quality Opp Share/True WOPR Share, Last 5 Weeks | DvP (Rk) / DvP, Last 5 (Rk) | Outlook: Value, MME-only, Look Elsewhere |
| Irv Smith Jr., TE | 61.0% | 12.9% / 11.1% | +0.9 FPA vs Avg (#21) / +4.6 FPA vs. Avg (#31) | MME-Only |
| Mike Boone, RB | 2.0% | 7.4% / 4.1% | -5.3 FPA vs Avg (#3) / -8.3 FPA vs. Avg (#4) | Look Elsewhere |
| C.J. Ham, RB | 42.0% | 0% / 0% | -5.3 FPA vs Avg (#3) / -8.3 FPA vs. Avg (#4) | Look Elsewhere |
Tampa Bay Buccaneers NFL DFS Picks
| Player | Snap Share, Last 5 Weeks | True Quality Opp Share/True WOPR Share, Last 5 Weeks | DvP (Rk) / DvP, Last 5 (Rk) | Outlook: Value, MME-only, Look Elsewhere |
| Cameron Brate, TE | 30.0% | 7.6% / 7.2% | -1.9 FPA vs Avg (#8) / +0.9 FPA vs. Avg (#21) | Look Elsewhere |
| Scotty Miller, WR | 37.0% | 10% / 12.3% | -1.3 FPA vs Avg (#8) / -0.9 FPA vs. Avg (#10) | Look Elsewhere |
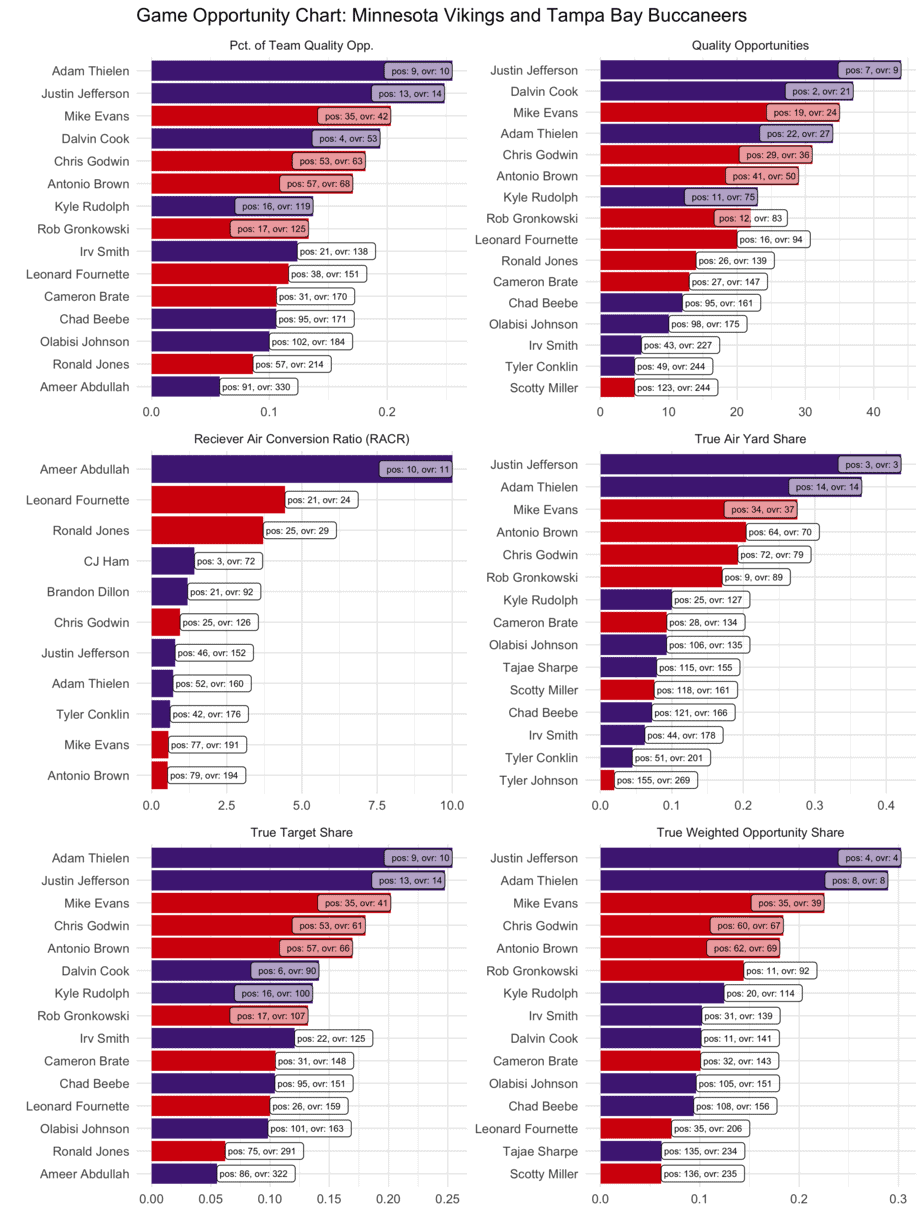
Skill Position Opportunities
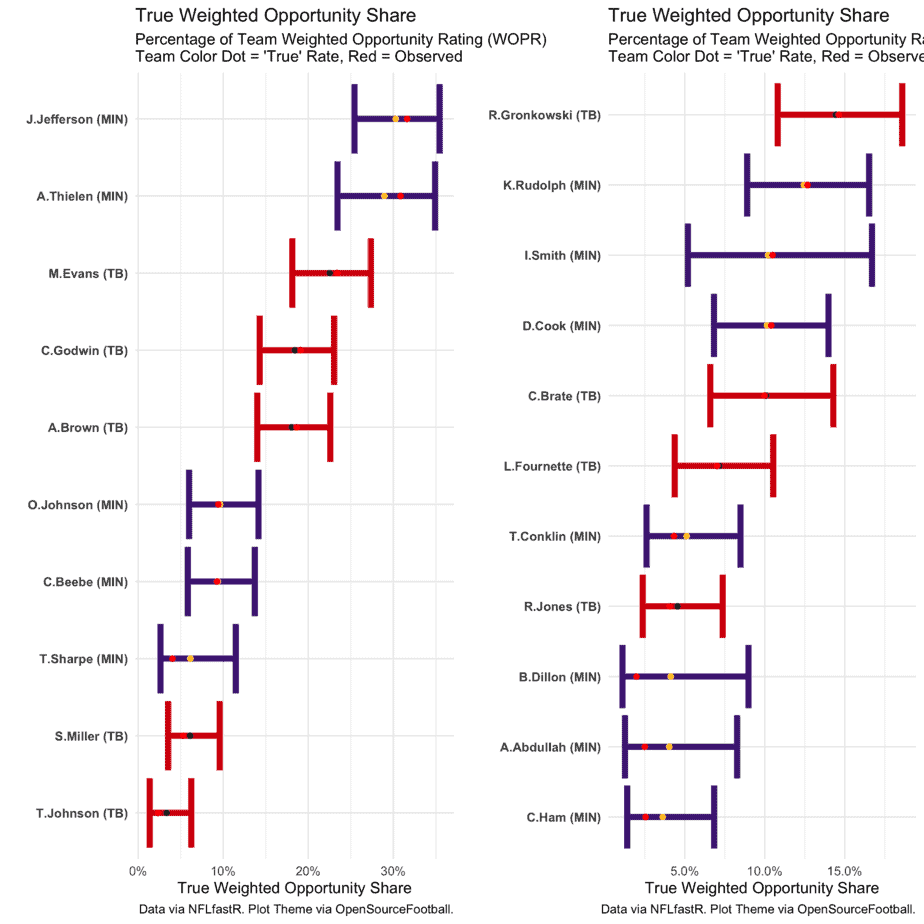
Range of Outcomes Analysis: Receiving Opportunity
Prediction: Buccaneers 31, Vikings 21
Looking for more NFL DFS picks and daily fantasy football matchups content? We have loads of articles, data and more on the Awesemo NFL home page. Just click HERE.
Tennessee Titans (30.5) at Jacksonville Jaguars (23)
All Graphs Reflect Last Five Weeks of Data, Click Graphs to Enlarge
Team Passing and Pace
Quarterback Play
NFL DFS Core Offenses
Let’s examine the primary skill players from each offense. For each player, their salary is compared to their fantasy points per game in column 2. Column 3 lists each player’s expected fantasy points (an excellent “catch-all” metric to measure usage) and fantasy points scored above or below expectation, a great proxy for efficiency. “DvP” measures the opposing defense’s fantasy points per game allowed above or below opponent averages. Finally, “xPROJ” combines a player’s expected fantasy points with their weekly matchup into one “expected projection” metric, which can be used to determine a player’s floor and ceiling.
Tennessee Titans NFL DFS Picks
| Player | Salary and FPts/Gm | Expected FPts & FPts vs. Expected | DvP (Rk) / DvP, Last 5 (Rk) | xPROJ |
| Ryan Tannehill, QB | $6700 (#8) / 20.5 FPts/Gm (#10) | 17.1 xFPTs/Gm (#19) / +3.4 FPvE (#3) | +2.9 FPA vs Avg (#30) / +2.7 FPA vs. Avg (#27) | 20 Fpts (QB7), -0.5 vs. Avg |
| Derrick Henry, RB | $8700 (#3) / 21 FPts/Gm (#6) | 19.1 xFPTs/Gm (#5) / +1.7 FPvE (#10) | +5 FPA vs Avg (#29) / +3.3 FPA vs. Avg (#25) | 23 Fpts (RB3), +2.2 vs. Avg |
| Corey Davis, WR | $5700 (#24) / 19 FPts/Gm (#11) | 15.7 xFPTs/Gm (#17) / +3.4 FPvE (#7) | +0.3 FPA vs Avg (#21) / +0.5 FPA vs. Avg (#20) | 16 Fpts (WR16), -3.1 vs. Avg |
| A.J. Brown, WR | $7300 (#8) / 20.5 FPts/Gm (#6) | 16.4 xFPTs/Gm (#12) / +4.2 FPvE (#5) | -0.9 FPA vs Avg (#12) / +2.7 FPA vs. Avg (#22) | 16 Fpts (WR16), -4.6 vs. Avg |
| Jonnu Smith, TE | $3900 (#12) / 11.5 FPts/Gm (#6) | 10.2 xFPTs/Gm (#6) / +1.4 FPvE (#6) | +0.7 FPA vs Avg (#20) / -1.2 FPA vs. Avg (#12) | 10.5 Fpts (TE7), -1.1 vs. Avg |
Jacksonville Jaguars NFL DFS Picks
| Player | Salary and FPts/Gm | Expected FPts & FPts vs. Expected | DvP (Rk) / DvP, Last 5 (Rk) | xPROJ |
| Mike Glennon, QB | $5100 (#21) / 16 FPts/Gm (#20) | 20.1 xFPTs/Gm (#8) / -4.1 FPvE (#32) | +1.9 FPA vs Avg (#26) / +1.1 FPA vs. Avg (#21) | 22 Fpts (QB3), +6 vs. Avg |
| James Robinson, RB | $7500 (#5) / 20.5 FPts/Gm (#7) | 18.7 xFPTs/Gm (#6) / +1.9 FPvE (#8) | +4.3 FPA vs Avg (#28) / +5.4 FPA vs. Avg (#28) | 22.5 Fpts (RB4), +1.9 vs. Avg |
| D.J. Chark Jr., WR | $5300 (#28) / 12 FPts/Gm (#41) | 12.4 xFPTs/Gm (#37) / -0.5 FPvE (#94) | -0.8 FPA vs Avg (#16) / -3.2 FPA vs. Avg (#7) | 12 Fpts (WR31), +0.1 vs. Avg |
| Laviska Shenault, WR | $4100 (#50) / 11.5 FPts/Gm (#44) | 9.6 xFPTs/Gm (#54) / +1.8 FPvE (#22) | +3.5 FPA vs Avg (#30) / +0.3 FPA vs. Avg (#16) | 10.5 Fpts (WR41), -0.9 vs. Avg |
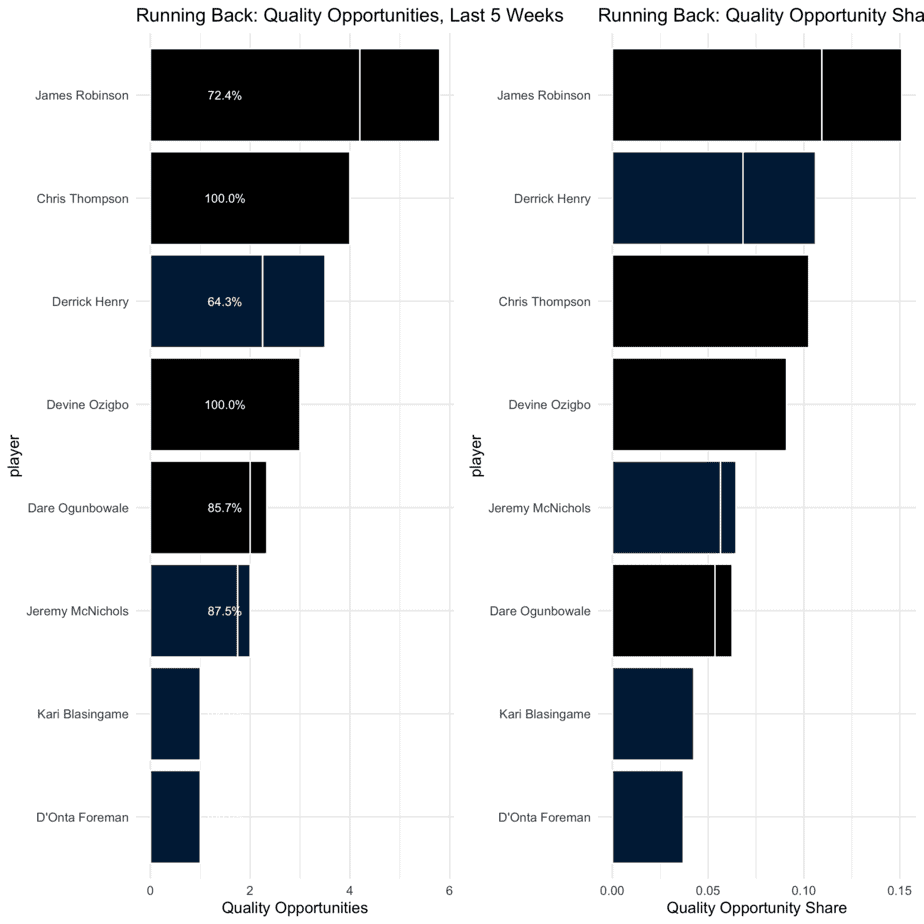
Running Back Quality Opportunities
Auxiliary Offenses
For lesser-utilized offensive players, let’s examine usage based on snap share, quality opportunity share and matchup. For each player, I categorize them as an NFL DFS value, a mass multi-entry option (MME-only) or a player to avoid altogether.
Tennessee Titans NFL DFS Picks
| Player | Snap Share, Last 5 Weeks | True Quality Opp Share/True WOPR Share, Last 5 Weeks | DvP (Rk) / DvP, Last 5 (Rk) | Outlook: Value, MME-only, Look Elsewhere |
| Anthony Firkser, TE | 41.0% | 14.5% / 13.2% | +0.7 FPA vs Avg (#20) / -1.2 FPA vs. Avg (#12) | MME-Only |
| Jeremy McNichols, RB | 31.0% | 6.7% / 4.6% | +5 FPA vs Avg (#29) / +3.3 FPA vs. Avg (#25) | Look Elsewhere |
| Kalif Raymond, WR | 25.5% | 7.6% / 9.1% | +2.3 FPA vs Avg (#28) / +0.4 FPA vs. Avg (#16) | Look Elsewhere |
| Cameron Batson, WR | 29.5% | 6.7% / 5% | +2.3 FPA vs Avg (#28) / +0.4 FPA vs. Avg (#16) | Look Elsewhere |
| D’Onta Foreman, RB | 7.5% | 7.5% / 5.2% | +5 FPA vs Avg (#29) / +3.3 FPA vs. Avg (#25) | Look Elsewhere |
| MyCole Pruitt, TE | 29.0% | 6% / 4.9% | +0.7 FPA vs Avg (#20) / -1.2 FPA vs. Avg (#12) | Look Elsewhere |
Jacksonville Jaguars NFL DFS Picks
| Player | Snap Share, Last 5 Weeks | True Quality Opp Share/True WOPR Share, Last 5 Weeks | DvP (Rk) / DvP, Last 5 (Rk) | Outlook: Value, MME-only, Look Elsewhere |
| Keelan Cole, WR | 77.5% | 13.2% / 15.1% | +1 FPA vs Avg (#24) / +4.2 FPA vs. Avg (#29) | MME-Only |
| Tyler Eifert, TE | 50.5% | 13% / 12.6% | +2.8 FPA vs Avg (#28) / +0.3 FPA vs. Avg (#16) | MME-Only |
| Collin Johnson, WR | 31.5% | 13.1% / 15% | +1 FPA vs Avg (#24) / +4.2 FPA vs. Avg (#29) | MME-Only |
| James O’Shaughnessy, TE | 52.5% | 8.5% / 8.2% | +2.8 FPA vs Avg (#28) / +0.3 FPA vs. Avg (#16) | Look Elsewhere |
| Dare Ogunbowale, RB | 11.0% | 7.2% / 5.2% | +4.3 FPA vs Avg (#28) / +5.4 FPA vs. Avg (#28) | Look Elsewhere |
| Chris Conley, WR | 46.5% | 11.9% / 11.4% | +1 FPA vs Avg (#24) / +4.2 FPA vs. Avg (#29) | Look Elsewhere |
Skill Position Opportunities
Range of Outcomes Analysis: Receiving Opportunity
Prediction: Titans 30, Jaguars 17
Looking for more NFL DFS picks and daily fantasy football matchups content? We have loads of articles, data and more on the Awesemo NFL home page. Just click HERE.
Indianapolis Colts (26.5) at Las Vegas Raiders (24)
All Graphs Reflect Last Five Weeks of Data, Click Graphs to Enlarge
Team Passing and Pace
Quarterback Play
NFL DFS Core Offenses
Let’s examine the primary skill players from each offense. For each player, their salary is compared to their fantasy points per game in column 2. Column 3 lists each player’s expected fantasy points (an excellent “catch-all” metric to measure usage) and fantasy points scored above or below expectation, a great proxy for efficiency. “DvP” measures the opposing defense’s fantasy points per game allowed above or below opponent averages. Finally, “xPROJ” combines a player’s expected fantasy points with their weekly matchup into one “expected projection” metric, which can be used to determine a player’s floor and ceiling.
Indianapolis Colts NFL DFS Picks
| Player | Salary and FPts/Gm | Expected FPts & FPts vs. Expected | DvP (Rk) / DvP, Last 5 (Rk) | xPROJ |
| Philip Rivers, QB | $5900 (#12) / 16 FPts/Gm (#19) | 15.8 xFPTs/Gm (#22) / +0.3 FPvE (#13) | -0.8 FPA vs Avg (#14) / +0.2 FPA vs. Avg (#15) | 15 Fpts (QB17), -1.1 vs. Avg |
| Jonathan Taylor, RB | $5800 (#19) / 14 FPts/Gm (#14) | 13.4 xFPTs/Gm (#20) / +0.7 FPvE (#17) | +4.2 FPA vs Avg (#27) / +0.4 FPA vs. Avg (#21) | 15.5 Fpts (RB12), +1.4 vs. Avg |
| T.Y. Hilton, WR | $5100 (#31) / 9 FPts/Gm (#62) | 9.5 xFPTs/Gm (#55) / -0.6 FPvE (#97) | +0.1 FPA vs Avg (#20) / +4.7 FPA vs. Avg (#29) | 9.5 Fpts (WR45), +0.6 vs. Avg |
| Michael Pittman Jr., WR | $5000 (#32) / 8.5 FPts/Gm (#63) | 8.5 xFPTs/Gm (#64) / +0.2 FPvE (#66) | -1.1 FPA vs Avg (#11) / -4 FPA vs. Avg (#6) | 8 Fpts (WR55), -0.7 vs. Avg |
| Nyheim Hines, RB | $5200 (#26) / 13 FPts/Gm (#20) | 12.4 xFPTs/Gm (#26) / +0.4 FPvE (#24) | +4.2 FPA vs Avg (#27) / +0.4 FPA vs. Avg (#21) | 14 Fpts (RB17), +1.2 vs. Avg |
Las Vegas Raiders NFL DFS Picks
| Player | Salary and FPts/Gm | Expected FPts & FPts vs. Expected | DvP (Rk) / DvP, Last 5 (Rk) | xPROJ |
| Derek Carr, QB | $6000 (#11) / 18.5 FPts/Gm (#13) | 18.5 xFPTs/Gm (#14) / +0.1 FPvE (#16) | -2.9 FPA vs Avg (#4) / -1.6 FPA vs. Avg (#10) | 15.5 Fpts (QB16), -3.1 vs. Avg |
| Darren Waller, TE | $6800 (#2) / 16.5 FPts/Gm (#2) | 16.1 xFPTs/Gm (#2) / +0.4 FPvE (#17) | -3 FPA vs Avg (#5) / -1.8 FPA vs. Avg (#10) | 13.5 Fpts (TE3), -3 vs. Avg |
| Devontae Booker, RB | $5300 (#24) / 7 FPts/Gm (#53) | 6.2 xFPTs/Gm (#56) / +0.6 FPvE (#19) | -3.6 FPA vs Avg (#7) / -1.9 FPA vs. Avg (#14) | 4 Fpts (RB52), -2.8 vs. Avg |
| Hunter Renfrow, WR | $4000 (#52) / 10 FPts/Gm (#53) | 9.1 xFPTs/Gm (#60) / +1.1 FPvE (#37) | -2.8 FPA vs Avg (#6) / -1.9 FPA vs. Avg (#11) | 8 Fpts (WR55), -2.2 vs. Avg |
| Nelson Agholor, WR | $4700 (#40) / 11.5 FPts/Gm (#42) | 10.2 xFPTs/Gm (#48) / +1.5 FPvE (#26) | -0.1 FPA vs Avg (#17) / +0 FPA vs. Avg (#14) | 10 Fpts (WR44), -1.7 vs. Avg |
Running Back Quality Opportunities
Auxiliary Offenses
For lesser-utilized offensive players, let’s examine usage based on snap share, quality opportunity share and matchup. For each player, I categorize them as an NFL DFS value, a mass multi-entry option (MME-only) or a player to avoid altogether.
Indianapolis Colts NFL DFS Picks
| Player | Snap Share, Last 5 Weeks | True Quality Opp Share/True WOPR Share, Last 5 Weeks | DvP (Rk) / DvP, Last 5 (Rk) | Outlook: Value, MME-only, Look Elsewhere |
| Mo Alie-Cox, TE | 54.0% | 9.7% / 9% | -0.4 FPA vs Avg (#11) / -1.6 FPA vs. Avg (#11) | Look Elsewhere |
| Zach Pascal, WR | 72.0% | 12.4% / 14% | -0.2 FPA vs Avg (#17) / +1.2 FPA vs. Avg (#20) | Look Elsewhere |
| Trey Burton, TE | 43.0% | 11.8% / 11.7% | -0.4 FPA vs Avg (#11) / -1.6 FPA vs. Avg (#11) | MME-Only |
| Jordan Wilkins, RB | 25.5% | 6.2% / 3.7% | +4.2 FPA vs Avg (#27) / +0.4 FPA vs. Avg (#21) | MME-Only |
| Marcus Johnson, WR | 45.5% | 12.3% / 17.2% | -0.2 FPA vs Avg (#17) / +1.2 FPA vs. Avg (#20) | Look Elsewhere |
| Jack Doyle, TE | 48.5% | 5.9% / 5.2% | -0.4 FPA vs Avg (#11) / -1.6 FPA vs. Avg (#11) | Look Elsewhere |
Las Vegas Raiders NFL DFS Picks
| Player | Snap Share, Last 5 Weeks | True Quality Opp Share/True WOPR Share, Last 5 Weeks | DvP (Rk) / DvP, Last 5 (Rk) | Outlook: Value, MME-only, Look Elsewhere |
| Henry Ruggs, WR | 70.5% | 0% / 0% | +0.4 FPA vs Avg (#19) / +3.6 FPA vs. Avg (#28) | MME-Only |
| Jalen Richard, RB | 23.0% | 6.6% / 3.7% | -3.6 FPA vs Avg (#7) / -1.9 FPA vs. Avg (#14) | MME-Only |
| Theo Riddick, RB | 16.5% | 5.4% / 3.5% | -3.6 FPA vs Avg (#7) / -1.9 FPA vs. Avg (#14) | Look Elsewhere |
| Alec Ingold, RB | 22.0% | 5.6% / 4.3% | -3.6 FPA vs Avg (#7) / -1.9 FPA vs. Avg (#14) | Look Elsewhere |
| Bryan Edwards, WR | 20.0% | 5.6% / 4.7% | +0.4 FPA vs Avg (#19) / +3.6 FPA vs. Avg (#28) | Look Elsewhere |
| Jason Witten, TE | 40.0% | 4.9% / 4% | -3 FPA vs Avg (#5) / -1.8 FPA vs. Avg (#10) | Look Elsewhere |
Skill Position Opportunities
Range of Outcomes Analysis: Receiving Opportunity
Prediction: Colts 27, Raiders 21
Looking for more NFL DFS picks and daily fantasy football matchups content? We have loads of articles, data and more on the Awesemo NFL home page. Just click HERE.
New York Jets (16.75) at Seattle Seahawks (30.25)
All Graphs Reflect Last Five Weeks of Data, Click Graphs to Enlarge
Team Passing and Pace
Quarterback Play
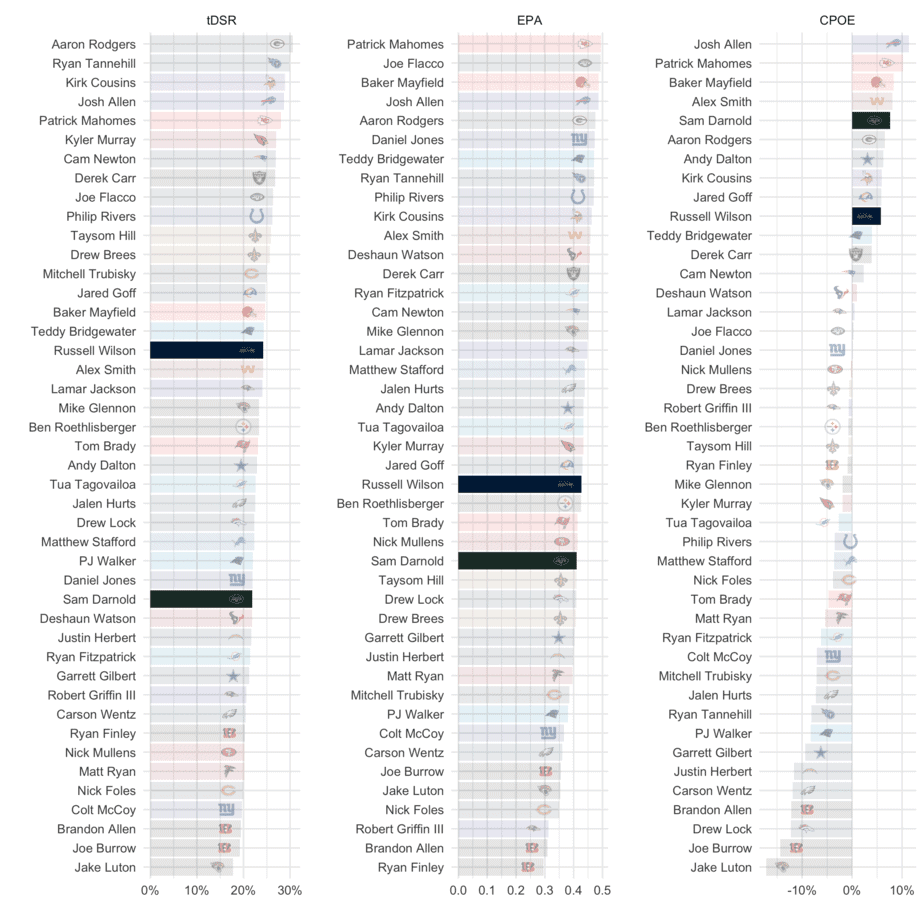
The three columns represent my three primary performance indicators for quarterbacks. Furthest left (tDSR) is True Drive Success Rate, a drive-based efficiency metric that measures a quarterback’s ability to turn drives into touchdowns, regressed based on sample size. The middle column, Expected Points Added (EPA), a metric that includes scrambles and designed rushes, is a measure of per-play efficiency. Finally, on the right is per-pass efficiency, Completion Percentage Over Expectation (CPOE) based on the publicly available completion percentage model included in the NFLFastR package.
NFL DFS Core Offenses
Let’s examine the primary skill players from each offense. For each player, their salary is compared to their fantasy points per game in column 2. Column 3 lists each player’s expected fantasy points (an excellent “catch-all” metric to measure usage) and fantasy points scored above or below expectation, a great proxy for efficiency. “DvP” measures the opposing defense’s fantasy points per game allowed above or below opponent averages. Finally, “xPROJ” combines a player’s expected fantasy points with their weekly matchup into one “expected projection” metric, which can be used to determine a player’s floor and ceiling.
New York Jets NFL DFS Picks
| Player | Salary and FPts/Gm | Expected FPts & FPts vs. Expected | DvP (Rk) / DvP, Last 5 (Rk) | xPROJ |
| Sam Darnold, QB | $5100 (#21) / 12 FPts/Gm (#26) | 14.6 xFPTs/Gm (#25) / -2.5 FPvE (#30) | +4.9 FPA vs Avg (#31) / +2.4 FPA vs. Avg (#26) | 19.5 Fpts (QB9), +7.4 vs. Avg |
| Jamison Crowder, WR | $5400 (#26) / 17 FPts/Gm (#19) | 15 xFPTs/Gm (#21) / +1.8 FPvE (#22) | +7 FPA vs Avg (#31) / +1 FPA vs. Avg (#22) | 17.5 Fpts (WR10), +0.7 vs. Avg |
| Ty Johnson, RB | $4700 (#38) / 4 FPts/Gm (#70) | 4.9 xFPTs/Gm (#65) / -1.1 FPvE (#65) | +0.5 FPA vs Avg (#19) / +4.7 FPA vs. Avg (#26) | 5 Fpts (RB48), +1.2 vs. Avg |
| Breshad Perriman, WR | $3900 (#54) / 11 FPts/Gm (#45) | 9.8 xFPTs/Gm (#52) / +1.2 FPvE (#29) | +5.5 FPA vs Avg (#31) / +5.9 FPA vs. Avg (#31) | 11.5 Fpts (WR32), +0.5 vs. Avg |
Seattle Seahawks NFL DFS Picks
| Player | Salary and FPts/Gm | Expected FPts & FPts vs. Expected | DvP (Rk) / DvP, Last 5 (Rk) | xPROJ |
| Russell Wilson, QB | $7900 (#2) / 25.5 FPts/Gm (#3) | 22.8 xFPTs/Gm (#2) / +2.5 FPvE (#6) | +1.3 FPA vs Avg (#22) / +3.1 FPA vs. Avg (#29) | 24 Fpts (QB2), -1.3 vs. Avg |
| DK Metcalf, WR | $8400 (#3) / 23 FPts/Gm (#3) | 19.1 xFPTs/Gm (#3) / +3.9 FPvE (#6) | +3.4 FPA vs Avg (#29) / +5.6 FPA vs. Avg (#30) | 20.5 Fpts (WR3), -2.5 vs. Avg |
| Tyler Lockett, WR | $7200 (#9) / 18.5 FPts/Gm (#15) | 17.3 xFPTs/Gm (#9) / +1.2 FPvE (#29) | +3.2 FPA vs Avg (#26) / +8.9 FPA vs. Avg (#30) | 18.5 Fpts (WR6), 0 vs. Avg |
| Chris Carson, RB | $6900 (#8) / 20.5 FPts/Gm (#8) | 17.4 xFPTs/Gm (#7) / +2.9 FPvE (#5) | +2.7 FPA vs Avg (#25) / -2 FPA vs. Avg (#13) | 19 Fpts (RB8), -1.3 vs. Avg |
Running Back Quality Opportunities
Auxiliary Offenses
For lesser-utilized offensive players, let’s examine usage based on snap share, quality opportunity share and matchup. For each player, I categorize them as an NFL DFS value, a mass multi-entry option (MME-only) or a player to avoid altogether.
New York Jets NFL DFS Picks
| Player | Snap Share, Last 5 Weeks | True Quality Opp Share/True WOPR Share, Last 5 Weeks | DvP (Rk) / DvP, Last 5 (Rk) | Outlook: Value, MME-only, Look Elsewhere |
| Josh Adams, RB | 17.0% | N/A | +0.5 FPA vs Avg (#19) / +4.7 FPA vs. Avg (#26) | Look Elsewhere |
| Chris Herndon, TE | 65.5% | 9.8% / 9.3% | -1.2 FPA vs Avg (#9) / -0.3 FPA vs. Avg (#15) | Look Elsewhere |
| Ryan Griffin, TE | 46.5% | 9.1% / 7.5% | -1.2 FPA vs Avg (#9) / -0.3 FPA vs. Avg (#15) | Look Elsewhere |
| Braxton Berrios, WR | 31.5% | 17.1% / 15.4% | +5.5 FPA vs Avg (#31) / +5.9 FPA vs. Avg (#31) | Look Elsewhere |
Seattle Seahawks NFL DFS Picks
| Player | Snap Share, Last 5 Weeks | True Quality Opp Share/True WOPR Share, Last 5 Weeks | DvP (Rk) / DvP, Last 5 (Rk) | Outlook: Value, MME-only, Look Elsewhere |
| David Moore, WR | 47.0% | 8.8% / 8.1% | -1.3 FPA vs Avg (#8) / -4 FPA vs. Avg (#3) | MME-Only |
| Jacob Hollister, TE | 36.0% | 9.9% / 8.6% | +1.6 FPA vs Avg (#25) / +4.1 FPA vs. Avg (#30) | MME-Only |
| Carlos Hyde, RB | 50.5% | 10.8% / 8% | +2.7 FPA vs Avg (#25) / -2 FPA vs. Avg (#13) | MME-Only |
| Will Dissly, TE | 54.5% | 6.7% / 5.9% | +1.6 FPA vs Avg (#25) / +4.1 FPA vs. Avg (#30) | MME-Only |
| Freddie Swain, WR | 31.5% | 5.7% / 6.2% | -1.3 FPA vs Avg (#8) / -4 FPA vs. Avg (#3) | Look Elsewhere |
| DeeJay Dallas, RB | 26.0% | 10.7% / 6% | +2.7 FPA vs Avg (#25) / -2 FPA vs. Avg (#13) | Look Elsewhere |
Skill Position Opportunities
Range of Outcomes Analysis: Receiving Opportunity
Prediction: Seahawks 33, Jets 17
Looking for more NFL DFS picks and daily fantasy football matchups content? We have loads of articles, data and more on the Awesemo NFL home page. Just click HERE.
New Orleans Saints (26.25) at Philadelphia Eagles (19.25)
All Graphs Reflect Last Five Weeks of Data, Click Graphs to Enlarge
Team Passing and Pace
Quarterback Play
NFL DFS Core Offenses
Let’s examine the primary skill players from each offense. For each player, their salary is compared to their fantasy points per game in column 2. Column 3 lists each player’s expected fantasy points (an excellent “catch-all” metric to measure usage) and fantasy points scored above or below expectation, a great proxy for efficiency. “DvP” measures the opposing defense’s fantasy points per game allowed above or below opponent averages. Finally, “xPROJ” combines a player’s expected fantasy points with their weekly matchup into one “expected projection” metric, which can be used to determine a player’s floor and ceiling.
New Orleans Saints NFL DFS Picks
| Player | Salary and FPts/Gm | Expected FPts & FPts vs. Expected | DvP (Rk) / DvP, Last 5 (Rk) | xPROJ |
| Taysom Hill, QB | $6600 (#9) / 8 FPts/Gm (#31) | 8 xFPTs/Gm (#31) / +0.2 FPvE (#14) | +1.5 FPA vs Avg (#24) / +1 FPA vs. Avg (#20) | 9.5 Fpts (QB25), +1.3 vs. Avg |
| Michael Thomas, WR | $7100 (#10) / 8.5 FPts/Gm (#65) | 11.3 xFPTs/Gm (#42) / -2.9 FPvE (#124) | -5.4 FPA vs Avg (#1) / -5.3 FPA vs. Avg (#2) | 8.5 Fpts (WR52), +0.1 vs. Avg |
| Alvin Kamara, RB | $7100 (#6) / 27 FPts/Gm (#3) | 23.4 xFPTs/Gm (#3) / +3.5 FPvE (#4) | -1.5 FPA vs Avg (#12) / -2.2 FPA vs. Avg (#12) | 22.5 Fpts (RB4), -4.4 vs. Avg |
| Emmanuel Sanders, WR | $4300 (#47) / 10.5 FPts/Gm (#48) | 10.5 xFPTs/Gm (#47) / +0.1 FPvE (#69) | -0.5 FPA vs Avg (#14) / -0.8 FPA vs. Avg (#11) | 10.5 Fpts (WR41), -0.1 vs. Avg |
| Latavius Murray, RB | $5400 (#23) / 9.5 FPts/Gm (#33) | 9.3 xFPTs/Gm (#39) / +0.4 FPvE (#24) | -1.5 FPA vs Avg (#12) / -2.2 FPA vs. Avg (#12) | 8.5 Fpts (RB33), -1.2 vs. Avg |
Philadelphia Eagles NFL DFS Picks
| Player | Salary and FPts/Gm | Expected FPts & FPts vs. Expected | DvP (Rk) / DvP, Last 5 (Rk) | xPROJ |
| Jalen Hurts, QB | $5100 (#21) / 1.5 FPts/Gm (#32) | 1.6 xFPTs/Gm (#32) / +0 FPvE (#17) | -1.5 FPA vs Avg (#9) / -6.6 FPA vs. Avg (#3) | 0 Fpts (QB26), -1.6 vs. Avg |
| Miles Sanders, RB | $6200 (#13) / 10.5 FPts/Gm (#30) | 12.5 xFPTs/Gm (#25) / -2.1 FPvE (#82) | -9.2 FPA vs Avg (#1) / -13.1 FPA vs. Avg (#2) | 7 Fpts (RB39), -3.4 vs. Avg |
| Dallas Goedert, TE | $4000 (#10) / 13 FPts/Gm (#4) | 11.7 xFPTs/Gm (#4) / +1.1 FPvE (#9) | -0.6 FPA vs Avg (#10) / -8.5 FPA vs. Avg (#1) | 11.5 Fpts (TE4), -1.3 vs. Avg |
| Jalen Reagor, WR | $4400 (#46) / 6 FPts/Gm (#83) | 7.6 xFPTs/Gm (#78) / -1.4 FPvE (#108) | -3.5 FPA vs Avg (#5) / -1.9 FPA vs. Avg (#11) | 6.5 Fpts (WR67), +0.3 vs. Avg |
| Greg Ward, WR | $3100 (#78) / 8.5 FPts/Gm (#66) | 8.6 xFPTs/Gm (#62) / -0.3 FPvE (#88) | +2 FPA vs Avg (#23) / +1.7 FPA vs. Avg (#20) | 9 Fpts (WR48), +0.7 vs. Avg |
| Zach Ertz, TE | $3700 (#14) / 2.5 FPts/Gm (#49) | 7.6 xFPTs/Gm (#21) / -5 FPvE (#66) | -0.6 FPA vs Avg (#10) / -8.5 FPA vs. Avg (#1) | 7.5 Fpts (TE19), +4.9 vs. Avg |
| Travis Fulgham, WR | $4900 (#35) / 11.5 FPts/Gm (#43) | 11.5 xFPTs/Gm (#41) / +0 FPvE (#75) | +0.5 FPA vs Avg (#20) / +3.1 FPA vs. Avg (#25) | 11.5 Fpts (WR32), 0 vs. Avg |
Running Back Quality Opportunities
Auxiliary Offenses
For lesser-utilized offensive players, let’s examine usage based on snap share, quality opportunity share and matchup. For each player, I categorize them as an NFL DFS value, a mass multi-entry option (MME-only) or a player to avoid altogether.
Never Miss An Active/Inactive Ever Again Don't get burned by a player being ruled out last minute, use our New NFL Depth Charts page to see starting lineups and inactive players for every team.New Orleans Saints NFL DFS Picks
| Player | Snap Share, Last 5 Weeks | True Quality Opp Share/True WOPR Share, Last 5 Weeks | DvP (Rk) / DvP, Last 5 (Rk) | Outlook: Value, MME-only, Look Elsewhere |
| Tre’Quan Smith, WR | 65.0% | 11.5% / 12.7% | +5.7 FPA vs Avg (#32) / +3.2 FPA vs. Avg (#26) | MME-Only |
| Jared Cook, TE | 40.0% | 11.6% / 13.4% | +2.5 FPA vs Avg (#27) / -2.6 FPA vs. Avg (#7) | MMe-Only |
| Adam Trautman, TE | 41.0% | 7.1% / 5.9% | +2.5 FPA vs Avg (#27) / -2.6 FPA vs. Avg (#7) | Look Elsewhere |
| Marquez Callaway, WR | 28.5% | 15.9% / 16.8% | +5.7 FPA vs Avg (#32) / +3.2 FPA vs. Avg (#26) | Look Elsewhere |
| Josh Hill, TE | 44.5% | 5.1% / 4.1% | +2.5 FPA vs Avg (#27) / -2.6 FPA vs. Avg (#7) | Look Elsewhere |
Philadelphia Eagles NFL DFS Picks
| Player | Snap Share, Last 5 Weeks | True Quality Opp Share/True WOPR Share, Last 5 Weeks | DvP (Rk) / DvP, Last 5 (Rk) | Outlook: Value, MME-only, Look Elsewhere |
| Boston Scott, RB | 45.5% | 10.5% / 7.8% | -9.2 FPA vs Avg (#1) / -13.1 FPA vs. Avg (#2) | MME-Only |
| Alshon Jeffery, WR | 34.5% | 6.7% / 6.5% | +0.5 FPA vs Avg (#20) / +3.1 FPA vs. Avg (#25) | MME-Only |
| John Hightower, WR | 25.5% | 7.4% / 10.9% | +0.5 FPA vs Avg (#20) / +3.1 FPA vs. Avg (#25) | Look Elsewhere |
| Jordan Howard, RB | 26.0% | 0% / 0% | -9.2 FPA vs Avg (#1) / -13.1 FPA vs. Avg (#2) | Look Elsewhere |
Skill Position Opportunities
Range of Outcomes Analysis: Receiving Opportunity
Prediction: Saints 24, Eagles 23
Looking for more NFL DFS picks and daily fantasy football matchups content? We have loads of articles, data and more on the Awesemo NFL home page. Just click HERE.
Washington Football Team (19.25) at San Francisco 49ers (24.25)
All Graphs Reflect Last Five Weeks of Data, Click Graphs to Enlarge
Team Passing and Pace
Quarterback Play
NFL DFS Core Offenses
Let’s examine the primary skill players from each offense. For each player, their salary is compared to their fantasy points per game in column 2. Column 3 lists each player’s expected fantasy points (an excellent “catch-all” metric to measure usage) and fantasy points scored above or below expectation, a great proxy for efficiency. “DvP” measures the opposing defense’s fantasy points per game allowed above or below opponent averages. Finally, “xPROJ” combines a player’s expected fantasy points with their weekly matchup into one “expected projection” metric, which can be used to determine a player’s floor and ceiling.
Washington Football Team NFL DFS Picks
| Player | Salary and FPts/Gm | Expected FPts & FPts vs. Expected | DvP (Rk) / DvP, Last 5 (Rk) | xPROJ |
| Alex Smith, QB | $5200 (#20) / 11 FPts/Gm (#28) | 12.7 xFPTs/Gm (#27) / -1.8 FPvE (#28) | -1.6 FPA vs Avg (#7) / -5 FPA vs. Avg (#4) | 11 Fpts (QB24), +0.1 vs. Avg |
| Terry McLaurin, WR | $6700 (#13) / 16 FPts/Gm (#22) | 15.8 xFPTs/Gm (#16) / +0.3 FPvE (#59) | +1.1 FPA vs Avg (#23) / +2.3 FPA vs. Avg (#27) | 16.5 Fpts (WR13), +0.4 vs. Avg |
| J.D. McKissic, RB | $4900 (#32) / 8.5 FPts/Gm (#41) | 10.5 xFPTs/Gm (#30) / -2.2 FPvE (#84) | -4 FPA vs Avg (#5) / -4.7 FPA vs. Avg (#8) | 8 Fpts (RB37), -0.3 vs. Avg |
| Peyton Barber, RB | $4400 (#41) / 1.5 FPts/Gm (#79) | 3.4 xFPTs/Gm (#73) / -1.8 FPvE (#78) | -4 FPA vs Avg (#5) / -4.7 FPA vs. Avg (#8) | 2 Fpts (RB63), +0.4 vs. Avg |
| Logan Thomas, TE | $3300 (#20) / 9.5 FPts/Gm (#9) | 9.7 xFPTs/Gm (#9) / -0.1 FPvE (#36) | -3.6 FPA vs Avg (#4) / -5.6 FPA vs. Avg (#5) | 6.5 Fpts (TE21), -3.1 vs. Avg |
San Francisco 49ers NFL DFS Picks
| Player | Salary and FPts/Gm | Expected FPts & FPts vs. Expected | DvP (Rk) / DvP, Last 5 (Rk) | xPROJ |
| Nick Mullens, QB | $5100 (#21) / 13 FPts/Gm (#25) | 14.6 xFPTs/Gm (#25) / -1.4 FPvE (#25) | -0.5 FPA vs Avg (#16) / -3.3 FPA vs. Avg (#7) | 14 Fpts (QB19), +0.8 vs. Avg |
| Deebo Samuel, WR | $6400 (#17) / 14 FPts/Gm (#32) | 13.3 xFPTs/Gm (#31) / +0.5 FPvE (#50) | -1 FPA vs Avg (#13) / -1.1 FPA vs. Avg (#14) | 13 Fpts (WR26), -0.8 vs. Avg |
| Raheem Mostert, RB | $6200 (#13) / 17 FPts/Gm (#9) | 14.3 xFPTs/Gm (#14) / +2.8 FPvE (#6) | -1.7 FPA vs Avg (#10) / -4.6 FPA vs. Avg (#9) | 13.5 Fpts (RB20), -3.6 vs. Avg |
| Brandon Aiyuk, WR | $5400 (#26) / 15.5 FPts/Gm (#25) | 15.1 xFPTs/Gm (#19) / +0.2 FPvE (#66) | -3.6 FPA vs Avg (#5) / -5.7 FPA vs. Avg (#4) | 14 Fpts (WR22), -1.3 vs. Avg |
| Jordan Reed, TE | $3500 (#18) / 9 FPts/Gm (#12) | 8.6 xFPTs/Gm (#16) / +0.5 FPvE (#14) | +0.9 FPA vs Avg (#21) / -2.7 FPA vs. Avg (#6) | 9.5 Fpts (TE10), +0.4 vs. Avg |
| Jeff Wilson Jr., RB | $4000 (#49) / 12.5 FPts/Gm (#22) | 10.3 xFPTs/Gm (#31) / +2.1 FPvE (#7) | -1.7 FPA vs Avg (#10) / -4.6 FPA vs. Avg (#9) | 10 Fpts (RB26), -2.4 vs. Avg |
Running Back Quality Opportunities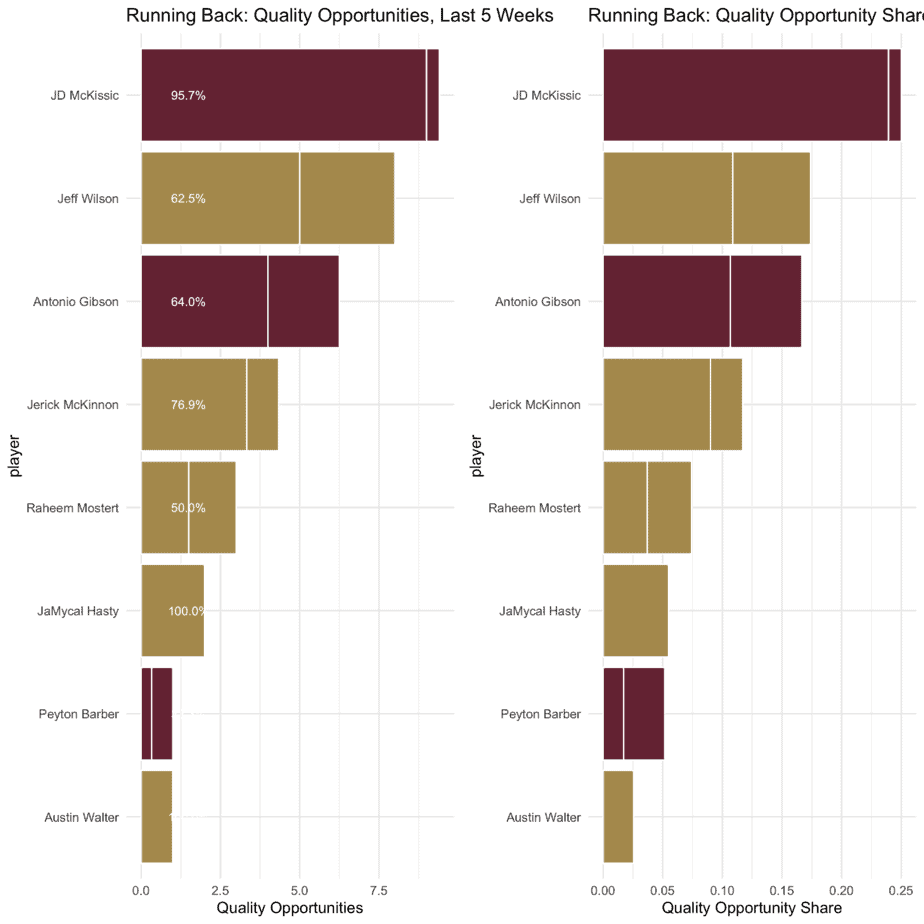
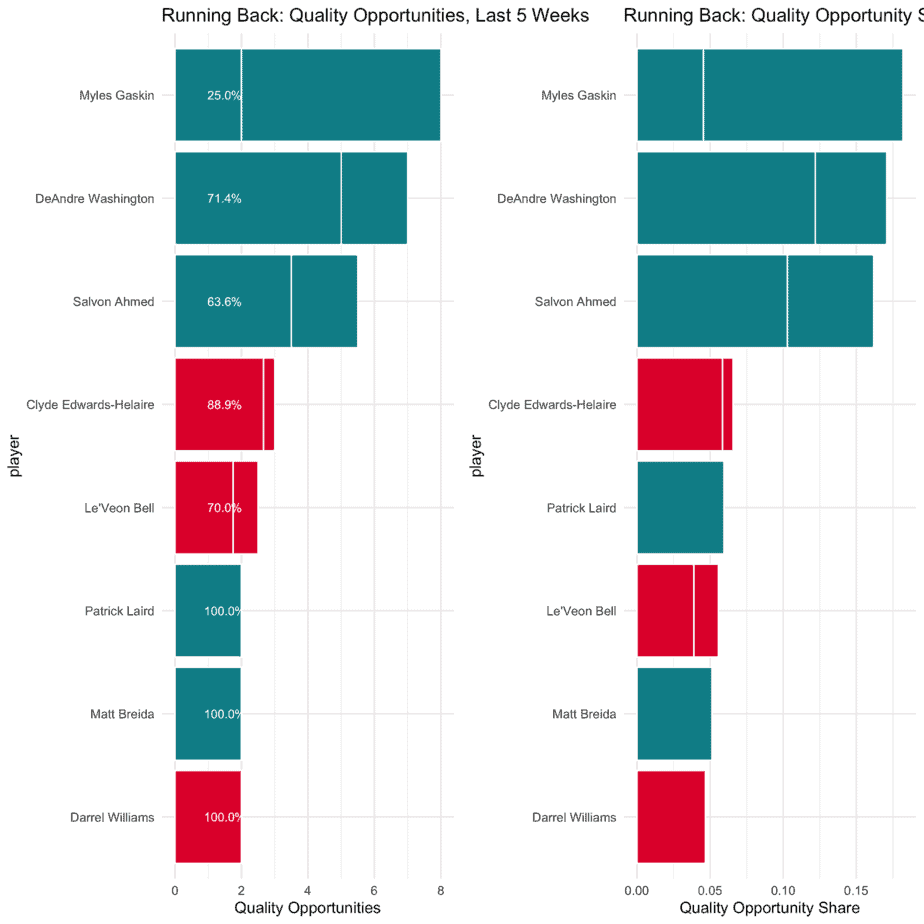
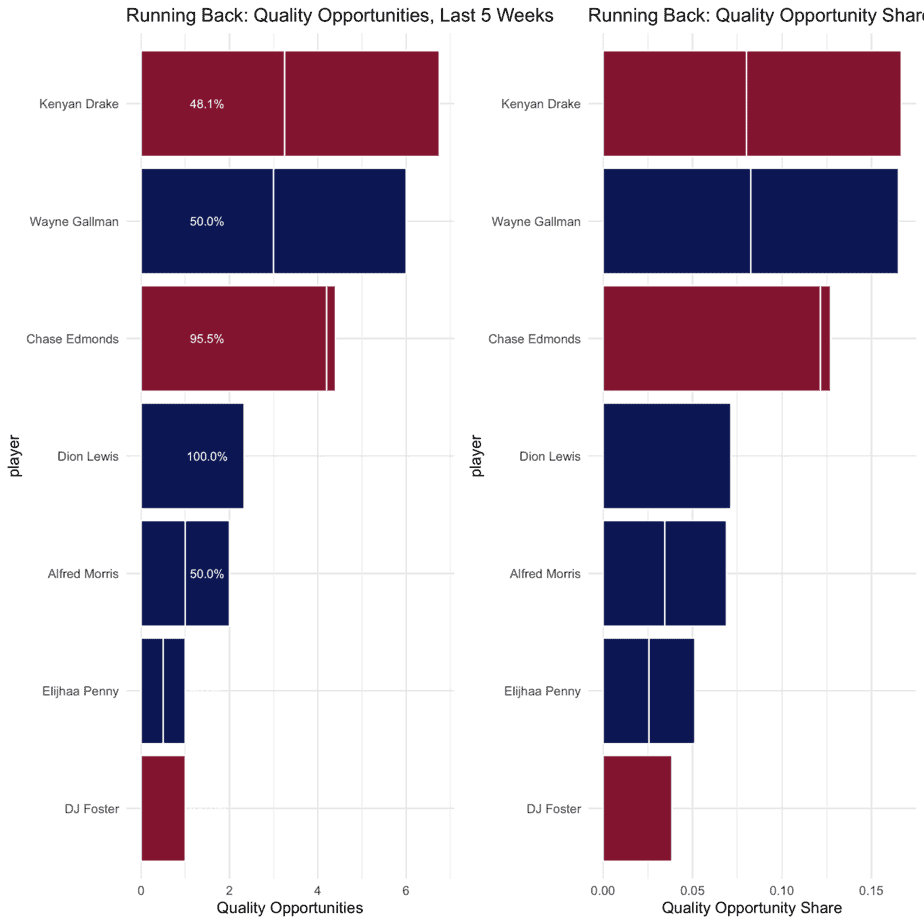
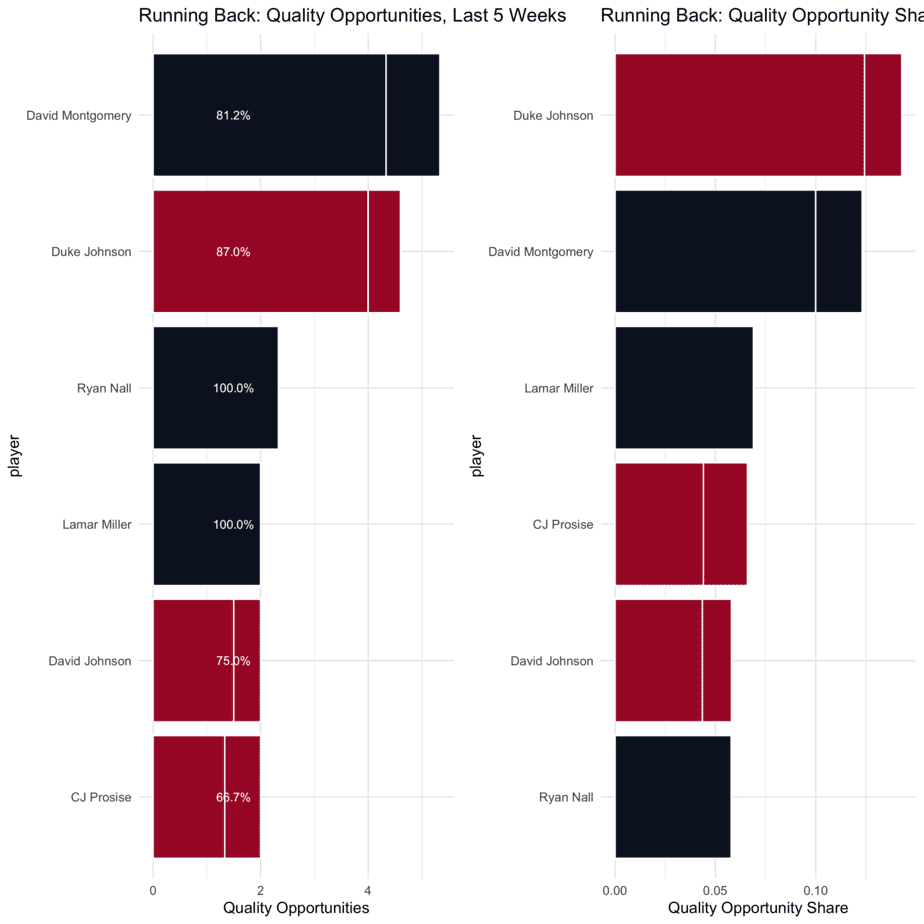
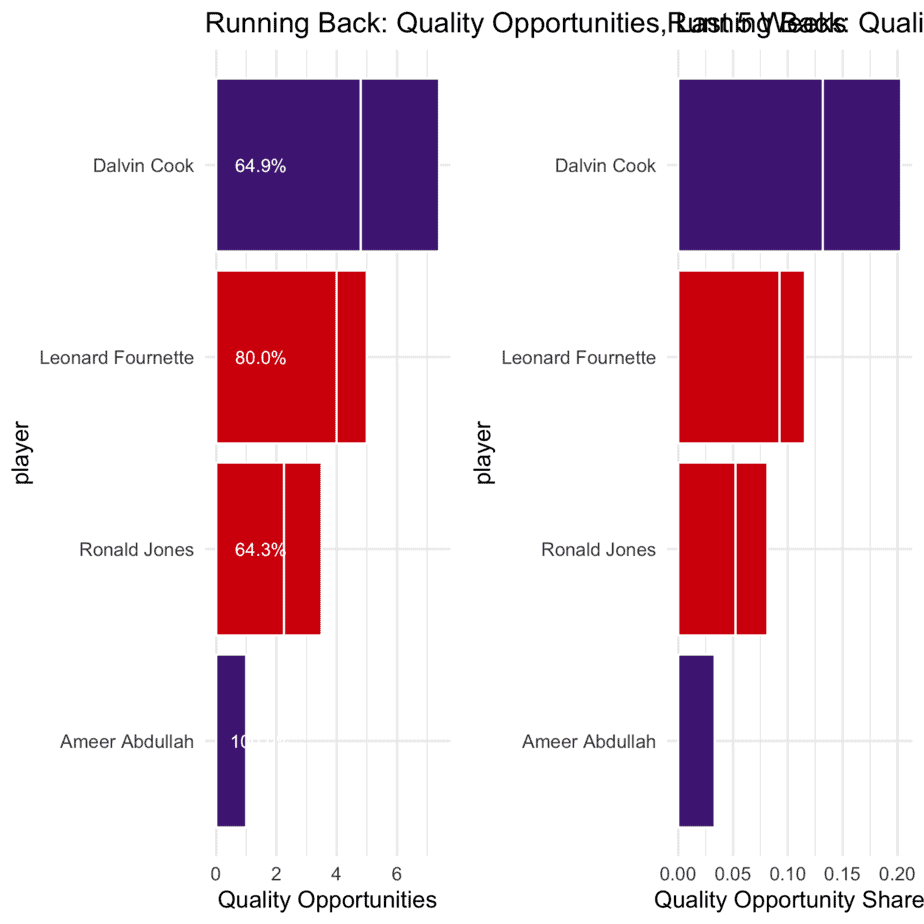
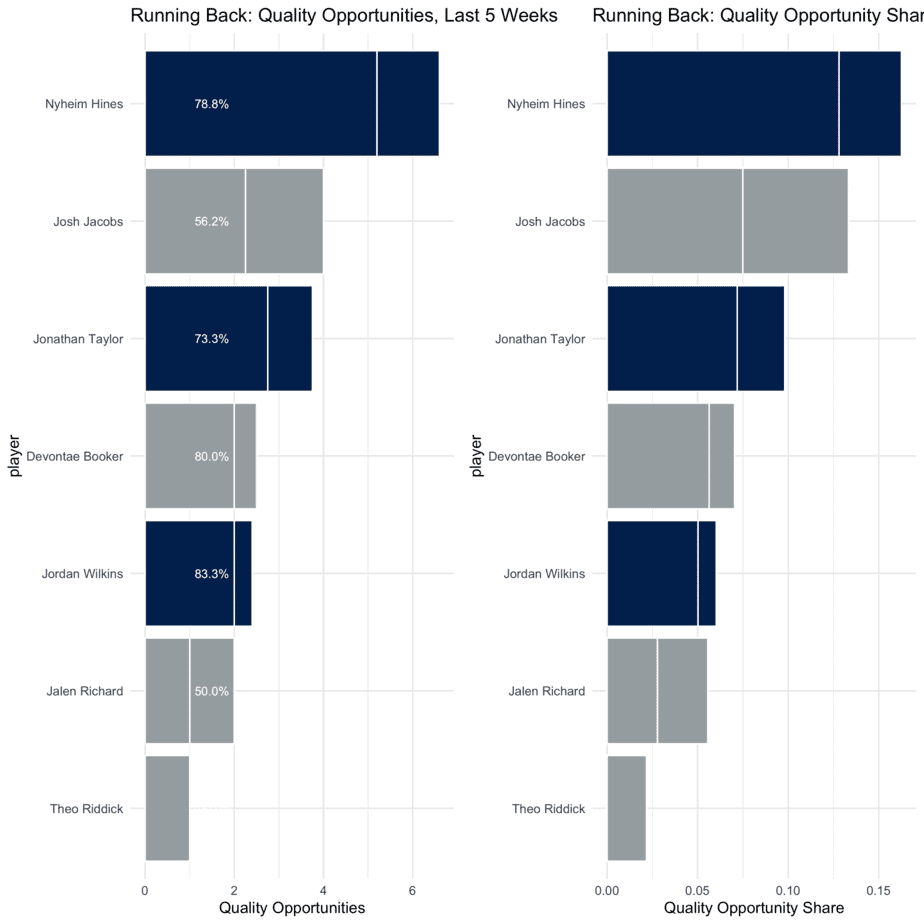
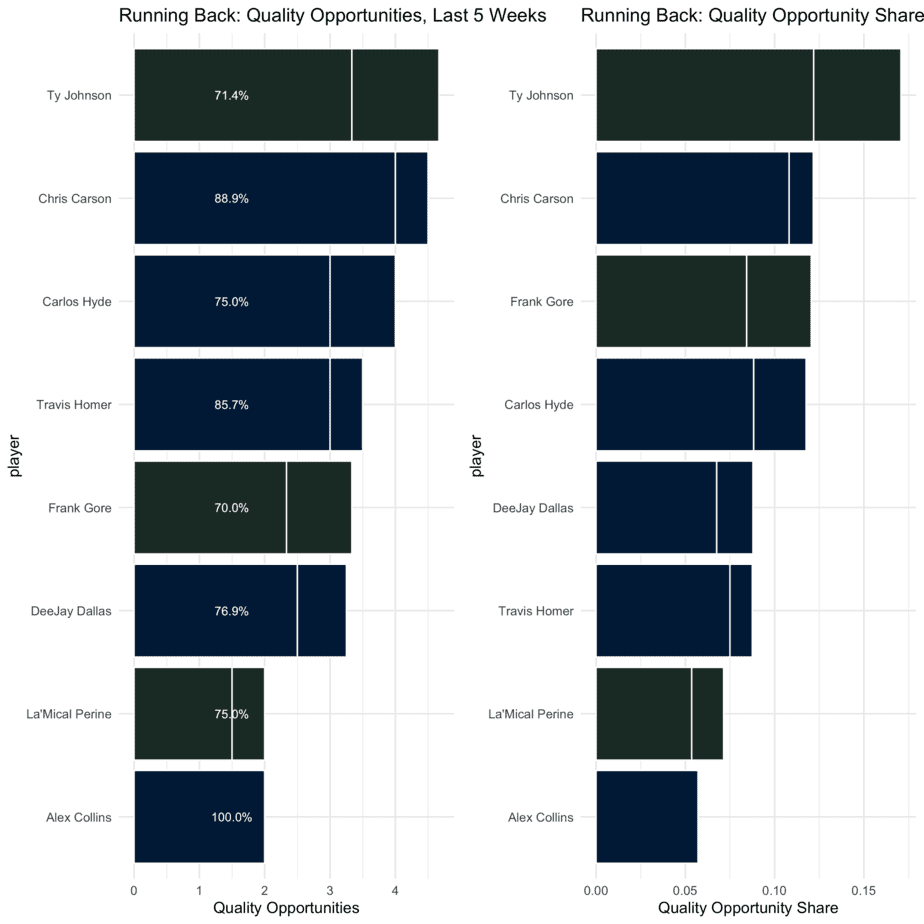
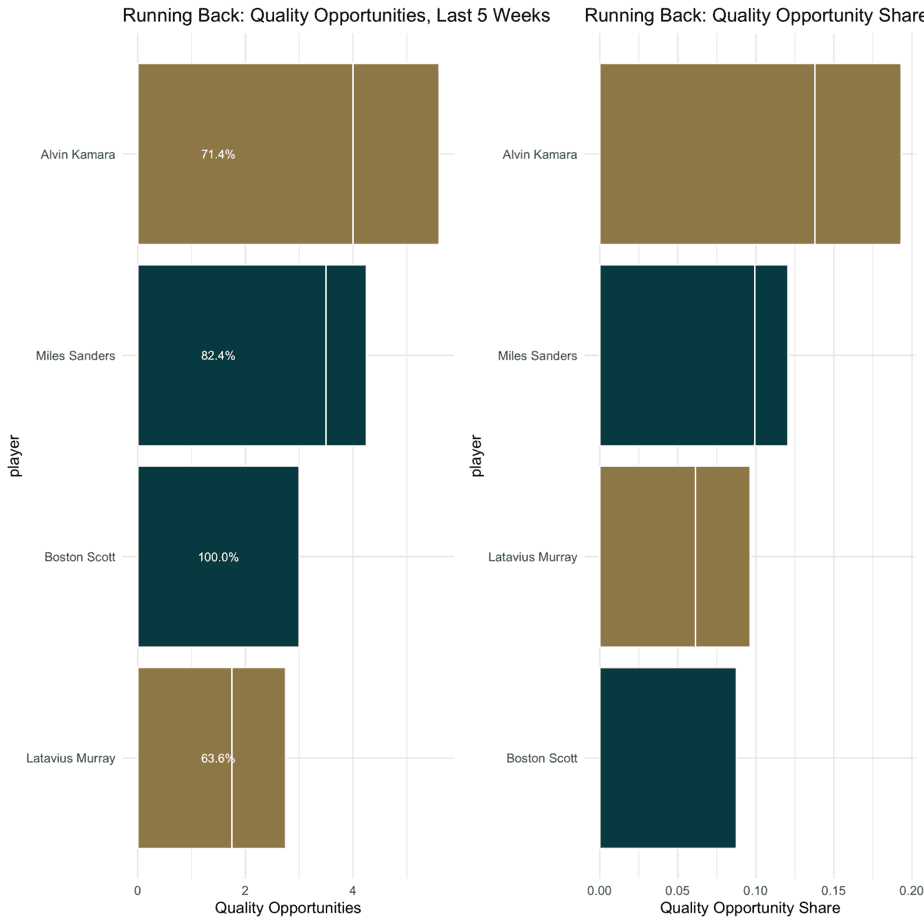
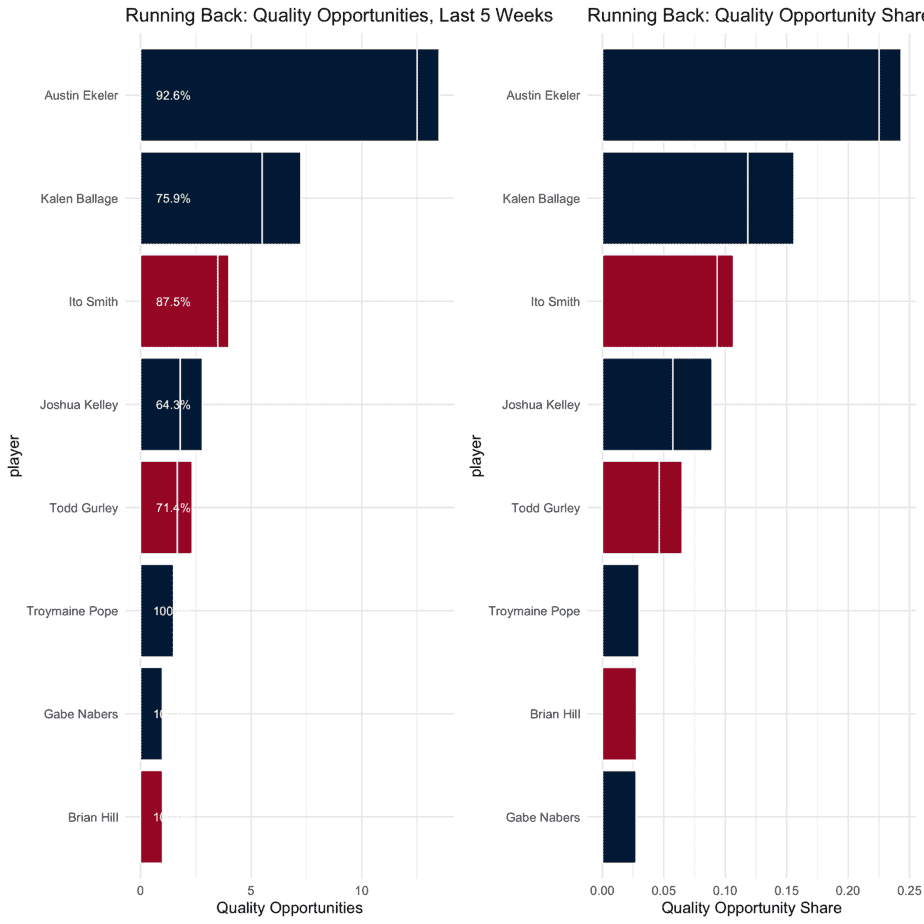
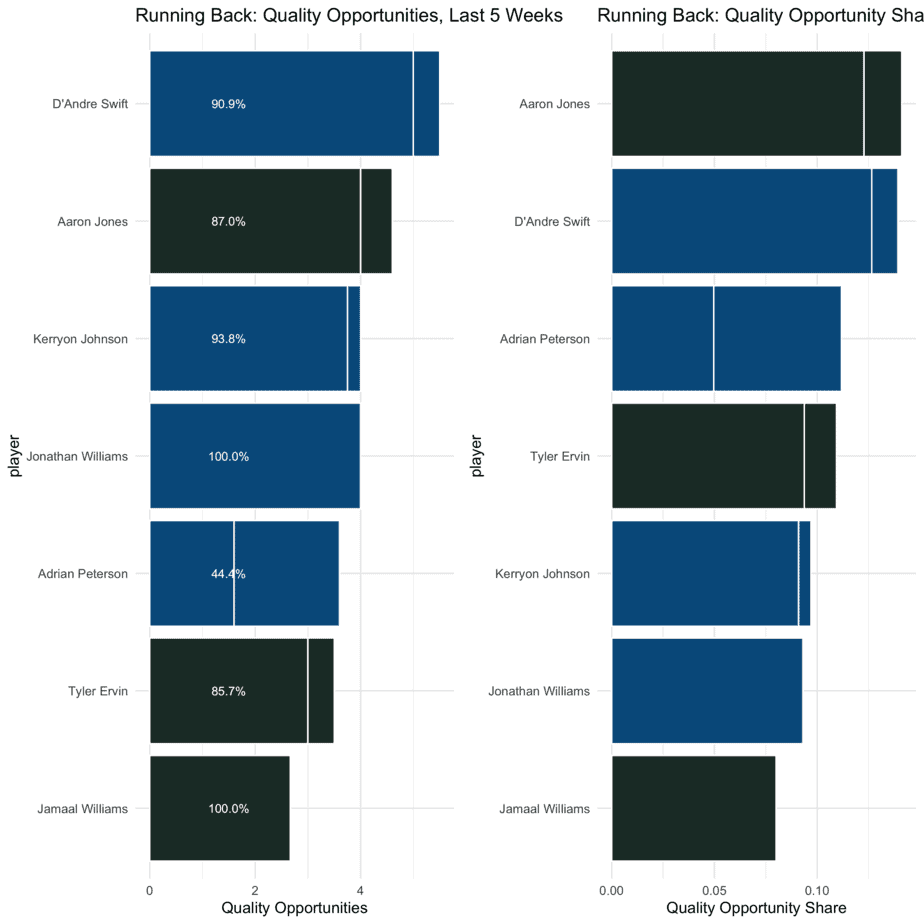
This chart measures Quality Opportunities per Game (Targets or Goalline carries), and its variant, Quality Opportunity Share, which are both key performance indicators for running backs. This metric helps filter so-called “empty touches” from a running back’s workload, and highlights the opportunities that are most likely to be successful for fantasy football. It includes injured players, in order to help contextualize players who might be receiving a smaller or larger workload based on personnel shifts.
Never Miss An Active/Inactive Ever Again Don't get burned by a player being ruled out last minute, use our New NFL Depth Charts page to see starting lineups and inactive players for every team.Auxiliary Offenses
For lesser-utilized offensive players, let’s examine usage based on snap share, quality opportunity share and matchup. For each player, I categorize them as an NFL DFS value, a mass multi-entry option (MME-only) or a player to avoid altogether.
Washington Football Team NFL DFS Picks
| Player | Snap Share, Last 5 Weeks | True Quality Opp Share/True WOPR Share, Last 5 Weeks | DvP (Rk) / DvP, Last 5 (Rk) | Outlook: Value, MME-only, Look Elsewhere |
| Isaiah Wright, WR | 39.0% | 9.7% / 8.6% | -0.7 FPA vs Avg (#13) / -0.9 FPA vs. Avg (#10) | Look Elsewhere |
| Steven Sims Jr., WR | 32.0% | 9.6% / 9.2% | -0.7 FPA vs Avg (#13) / -0.9 FPA vs. Avg (#10) | Look Elsewhere |
| Dontrelle Inman, WR | 38.0% | 9.9% / 10.1% | -0.7 FPA vs Avg (#13) / -0.9 FPA vs. Avg (#10) | Look Elsewhere |
San Francisco 49ers NFL DFS Picks
| Player | Snap Share, Last 5 Weeks | True Quality Opp Share/True WOPR Share, Last 5 Weeks | DvP (Rk) / DvP, Last 5 (Rk) | Outlook: Value, MME-only, Look Elsewhere |
| Kendrick Bourne, WR | 59.0% | 14% / 14.4% | -0.7 FPA vs Avg (#13) / +0.5 FPA vs. Avg (#17) | MME-Only |
| Tevin Coleman, RB | 7.5% | 0% / 0% | -1.7 FPA vs Avg (#10) / -4.6 FPA vs. Avg (#9) | Look Elsewhere |
| Jerick McKinnon, RB | 37.5% | 11.7% / 8.3% | -1.7 FPA vs Avg (#10) / -4.6 FPA vs. Avg (#9) | MME-Only |
| Kyle Juszczyk, RB | 37.5% | 5.7% / 5.2% | -1.7 FPA vs Avg (#10) / -4.6 FPA vs. Avg (#9) | Look Elsewhere |
| Ross Dwelley, TE | 51.0% | 7.5% / 7.8% | +0.9 FPA vs Avg (#21) / -2.7 FPA vs. Avg (#6) | Look Elsewhere |
| Richie James, WR | 53.5% | 16.7% / 20.8% | -0.7 FPA vs Avg (#13) / +0.5 FPA vs. Avg (#17) | MME-Only |
Skill Position Opportunities
Range of Outcomes Analysis: Receiving Opportunity
Prediction: 49ers 27, Washington 26.
Looking for more NFL DFS picks and daily fantasy football matchups content? We have loads of articles, data and more on the Awesemo NFL home page. Just click HERE.
Atlanta Falcons (26.25) at Los Angeles Chargers (23.75)
All Graphs Reflect Last Five Weeks of Data, Click Graphs to Enlarge
Team Passing and Pace
Quarterback Play
NFL DFS Core Offenses
Let’s examine the primary skill players from each offense. For each player, their salary is compared to their fantasy points per game in column 2. Column 3 lists each player’s expected fantasy points (an excellent “catch-all” metric to measure usage) and fantasy points scored above or below expectation, a great proxy for efficiency. “DvP” measures the opposing defense’s fantasy points per game allowed above or below opponent averages. Finally, “xPROJ” combines a player’s expected fantasy points with their weekly matchup into one “expected projection” metric, which can be used to determine a player’s floor and ceiling.
Atlanta Falcons NFL DFS Picks
| Player | Salary and FPts/Gm | Expected FPts & FPts vs. Expected | DvP (Rk) / DvP, Last 5 (Rk) | xPROJ |
| Matt Ryan, QB | $5700 (#14) / 18 FPts/Gm (#17) | 19.2 xFPTs/Gm (#12) / -1.3 FPvE (#23) | +2.4 FPA vs Avg (#29) / +1.4 FPA vs. Avg (#22) | 21.5 Fpts (QB5), +3.6 vs. Avg |
| Julio Jones, WR | $6600 (#14) / 18.5 FPts/Gm (#14) | 16.2 xFPTs/Gm (#14) / +2.4 FPvE (#13) | -4 FPA vs Avg (#2) / -7 FPA vs. Avg (#1) | 14.5 Fpts (WR20), -4.1 vs. Avg |
| Calvin Ridley, WR | $7500 (#6) / 18.5 FPts/Gm (#13) | 17.5 xFPTs/Gm (#8) / +1.2 FPvE (#29) | +0.7 FPA vs Avg (#19) / +0.7 FPA vs. Avg (#17) | 18 Fpts (WR8), -0.7 vs. Avg |
| Todd Gurley II, RB | $4800 (#35) / 12 FPts/Gm (#24) | 12.9 xFPTs/Gm (#23) / -0.7 FPvE (#53) | +2.4 FPA vs Avg (#24) / +7.7 FPA vs. Avg (#31) | 14 Fpts (RB17), +1.8 vs. Avg |
Los Angeles Chargers NFL DFS Picks
| Player | Salary and FPts/Gm | Expected FPts & FPts vs. Expected | DvP (Rk) / DvP, Last 5 (Rk) | xPROJ |
| Justin Herbert, QB | $6800 (#7) / 22.5 FPts/Gm (#7) | 20.9 xFPTs/Gm (#7) / +1.6 FPvE (#9) | +7.8 FPA vs Avg (#32) / +4.5 FPA vs. Avg (#30) | 28.5 Fpts (QB1), +6 vs. Avg |
| Austin Ekeler, RB | $7000 (#7) / 16 FPts/Gm (#10) | 16.2 xFPTs/Gm (#10) / +0 FPvE (#34) | -4.9 FPA vs Avg (#4) / -16.1 FPA vs. Avg (#1) | 12.5 Fpts (RB23), -3.7 vs. Avg |
| Keenan Allen, WR | $7700 (#4) / 19.5 FPts/Gm (#8) | 18.7 xFPTs/Gm (#4) / +0.8 FPvE (#42) | +2.3 FPA vs Avg (#26) / +2.7 FPA vs. Avg (#28) | 20 Fpts (WR4), +0.5 vs. Avg |
| Mike Williams, WR | $4700 (#40) / 11 FPts/Gm (#47) | 10.7 xFPTs/Gm (#46) / +0.1 FPvE (#69) | +3.4 FPA vs Avg (#27) / +8.1 FPA vs. Avg (#28) | 11.5 Fpts (WR32), +0.7 vs. Avg |
| Hunter Henry, TE | $4400 (#6) / 8.5 FPts/Gm (#14) | 9.8 xFPTs/Gm (#8) / -1.1 FPvE (#60) | +6.3 FPA vs Avg (#32) / +1.4 FPA vs. Avg (#23) | 15 Fpts (TE2), +6.3 vs. Avg |
Running Back Quality Opportunities
Auxiliary Offenses
For lesser-utilized offensive players, let’s examine usage based on snap share, quality opportunity share and matchup. For each player, I categorize them as an NFL DFS value, a mass multi-entry option (MME-only) or a player to avoid altogether.
Atlanta Falcons NFL DFS Picks
| Player | Snap Share, Last 5 Weeks | True Quality Opp Share/True WOPR Share, Last 5 Weeks | DvP (Rk) / DvP, Last 5 (Rk) | Outlook: Value, MME-only, Look Elsewhere |
| Russell Gage, WR | 70.0% | 17.4% / 17.2% | -0.9 FPA vs Avg (#12) / +1.2 FPA vs. Avg (#20) | MME-Only |
| Hayden Hurst, TE | 72.0% | 15.6% / 13.9% | +3.1 FPA vs Avg (#29) / +2.6 FPA vs. Avg (#27) | MME-Only |
| Brian Hill, RB | 33.0% | 6.7% / 4.6% | +2.4 FPA vs Avg (#24) / +7.7 FPA vs. Avg (#31) | Look Elsewhere |
| Ito Smith, RB | 24.0% | 7.2% / 5% | +2.4 FPA vs Avg (#24) / +7.7 FPA vs. Avg (#31) | Look Elsewhere |
| Brandon Powell, WR | 10.0% | 5.1% / 3.9% | -0.9 FPA vs Avg (#12) / +1.2 FPA vs. Avg (#20) | Look Elsewhere |
Los Angeles Chargers NFL DFS Picks
| Player | Snap Share, Last 5 Weeks | True Quality Opp Share/True WOPR Share, Last 5 Weeks | DvP (Rk) / DvP, Last 5 (Rk) | Outlook: Value, MME-only, Look Elsewhere |
| Kalen Ballage, RB | 53.5% | 15.2% / 9.1% | -4.9 FPA vs Avg (#4) / -16.1 FPA vs. Avg (#1) | Look Elsewhere |
| Jalen Guyton, WR | 80.5% | 9% / 10.8% | +1.4 FPA vs Avg (#26) / +2.4 FPA vs. Avg (#24) | MME-Only |
| Tyron Johnson, WR | 15.5% | 4.2% / 6.9% | +1.4 FPA vs Avg (#26) / +2.4 FPA vs. Avg (#24) | Look Elsewhere |
| Donald Parham Jr., TE | 0% / 0% | +6.3 FPA vs Avg (#32) / +1.4 FPA vs. Avg (#23) | Look Elsewhere | |
| Joshua Kelley, RB | 28.0% | 8.9% / 5.2% | -4.9 FPA vs Avg (#4) / -16.1 FPA vs. Avg (#1) | Look Elsewhere |
Skill Position Opportunities
Range of Outcomes Analysis: Receiving Opportunity
Prediction: Chargers 31, Falcons 27
Looking for more NFL DFS picks and daily fantasy football matchups content? We have loads of articles, data and more on the Awesemo NFL home page. Just click HERE.
Green Bay Packers (31.5) at Detroit Lions (23.5)
All Graphs Reflect Last Five Weeks of Data, Click Graphs to Enlarge
Team Passing and Pace
Quarterback Play
NFL DFS Core Offenses
Let’s examine the primary skill players from each offense. For each player, their salary is compared to their fantasy points per game in column 2. Column 3 lists each player’s expected fantasy points (an excellent “catch-all” metric to measure usage) and fantasy points scored above or below expectation, a great proxy for efficiency. “DvP” measures the opposing defense’s fantasy points per game allowed above or below opponent averages. Finally, “xPROJ” combines a player’s expected fantasy points with their weekly matchup into one “expected projection” metric, which can be used to determine a player’s floor and ceiling.
Green Bay Packers NFL DFS Picks
| Player | Salary and FPts/Gm | Expected FPts & FPts vs. Expected | DvP (Rk) / DvP, Last 5 (Rk) | xPROJ |
| Aaron Rodgers, QB | $7500 (#4) / 24 FPts/Gm (#5) | 19.6 xFPTs/Gm (#10) / +4.6 FPvE (#2) | +0.1 FPA vs Avg (#19) / +1.4 FPA vs. Avg (#22) | 19.5 Fpts (QB9), -4.7 vs. Avg |
| Davante Adams, WR | $9300 (#1) / 32.5 FPts/Gm (#1) | 26.5 xFPTs/Gm (#1) / +5.9 FPvE (#1) | -2.4 FPA vs Avg (#7) / -3.9 FPA vs. Avg (#5) | 25 Fpts (WR1), -7.4 vs. Avg |
| Aaron Jones, RB | $7600 (#4) / 21 FPts/Gm (#5) | 19.3 xFPTs/Gm (#4) / +1.7 FPvE (#10) | +8.4 FPA vs Avg (#32) / +11.1 FPA vs. Avg (#32) | 25 Fpts (RB2), +4 vs. Avg |
| Allen Lazard, WR | $5000 (#32) / 15.5 FPts/Gm (#25) | 12.7 xFPTs/Gm (#36) / +2.6 FPvE (#10) | -0.2 FPA vs Avg (#16) / +1.2 FPA vs. Avg (#19) | 12.5 Fpts (WR28), -2.8 vs. Avg |
| Jamaal Williams, RB | $6000 (#16) / 9.5 FPts/Gm (#35) | 10.2 xFPTs/Gm (#32) / -0.7 FPvE (#53) | +8.4 FPA vs Avg (#32) / +11.1 FPA vs. Avg (#32) | 13 Fpts (RB21), +3.5 vs. Avg |
Detroit Lions NFL DFS Picks
| Player | Salary and FPts/Gm | Expected FPts & FPts vs. Expected | DvP (Rk) / DvP, Last 5 (Rk) | xPROJ |
| Matthew Stafford, QB | $5700 (#14) / 18 FPts/Gm (#18) | 18.2 xFPTs/Gm (#15) / -0.4 FPvE (#21) | -1.4 FPA vs Avg (#10) / -1.5 FPA vs. Avg (#11) | 17 Fpts (QB13), -0.8 vs. Avg |
| D’Andre Swift, RB | $6500 (#10) / 15.5 FPts/Gm (#12) | 14.2 xFPTs/Gm (#15) / +1.4 FPvE (#14) | +5.1 FPA vs Avg (#30) / +1.8 FPA vs. Avg (#24) | 17 Fpts (RB9), +1.4 vs. Avg |
| Kenny Golladay, WR | $6000 (#22) / 14.5 FPts/Gm (#30) | 13.2 xFPTs/Gm (#32) / +1.5 FPvE (#26) | -0.9 FPA vs Avg (#15) / +1.8 FPA vs. Avg (#26) | 13 Fpts (WR26), -1.7 vs. Avg |
| T.J. Hockenson, TE | $5000 (#3) / 12 FPts/Gm (#5) | 12 xFPTs/Gm (#3) / -0.1 FPvE (#36) | -4.1 FPA vs Avg (#3) / -6.3 FPA vs. Avg (#4) | 8.5 Fpts (TE14), -3.4 vs. Avg |
| Marvin Jones Jr., WR | $5800 (#23) / 12.5 FPts/Gm (#39) | 12.4 xFPTs/Gm (#37) / -0.1 FPvE (#83) | -3.3 FPA vs Avg (#6) / -0.9 FPA vs. Avg (#10) | 11.5 Fpts (WR32), -0.8 vs. Avg |
Running Back Quality Opportunities
Auxiliary Offenses
For lesser-utilized offensive players, let’s examine usage based on snap share, quality opportunity share and matchup. For each player, I categorize them as an NFL DFS value, a mass multi-entry option (MME-only) or a player to avoid altogether.
Green Bay Packers NFL DFS Picks
| Player | Snap Share, Last 5 Weeks | True Quality Opp Share/True WOPR Share, Last 5 Weeks | DvP (Rk) / DvP, Last 5 (Rk) | Outlook: Value, MME-only, Look Elsewhere |
| Robert Tonyan, TE | 61.0% | 12.5% / 12.3% | -0.2 FPA vs Avg (#14) / +5.1 FPA vs. Avg (#32) | Value |
| Marquez Valdes-Scantling, WR | 84.0% | 12% / 16.9% | +3.1 FPA vs Avg (#30) / +1 FPA vs. Avg (#19) | Look Elsewhere |
| Jace Sternberger, TE | 27.0% | 6.7% / 5.8% | -0.2 FPA vs Avg (#14) / +5.1 FPA vs. Avg (#32) | Look Elsewhere |
| Equanimeous St. Brown, WR | N/A | 6.8% / 6.8% | +3.1 FPA vs Avg (#30) / +1 FPA vs. Avg (#19) | Look Elsewhere |
| Marcedes Lewis, TE | 41.5% | 6.9% / 6.3% | -0.2 FPA vs Avg (#14) / +5.1 FPA vs. Avg (#32) | Look Elsewhere |
Detroit Lions NFL DFS Picks
| Player | Snap Share, Last 5 Weeks | True Quality Opp Share/True WOPR Share, Last 5 Weeks | DvP (Rk) / DvP, Last 5 (Rk) | Outlook: Value, MME-only, Look Elsewhere |
| Adrian Peterson, RB | 28.5% | 8.7% / 0% | +5.1 FPA vs Avg (#30) / +1.8 FPA vs. Avg (#24) | MME-Only |
| Danny Amendola, WR | 50.5% | 12.6% / 0% | -1.3 FPA vs Avg (#8) / +0.2 FPA vs. Avg (#15) | Look Elsewhere |
| Kerryon Johnson, RB | 35.5% | 8.8% / 0% | +5.1 FPA vs Avg (#30) / +1.8 FPA vs. Avg (#24) | MME-Only |
| Quintez Cephus, WR | 39.5% | 6.9% / 0% | -1.3 FPA vs Avg (#8) / +0.2 FPA vs. Avg (#15) | MME-Only |
| Jamal Agnew, WR | 27.5% | 7.3% / 0% | -1.3 FPA vs Avg (#8) / +0.2 FPA vs. Avg (#15) | Look Elsewhere |
| Jesse James, TE | 44.0% | 5.5% / 0% | -4.1 FPA vs Avg (#3) / -6.3 FPA vs. Avg (#4) | Look Elsewhere |
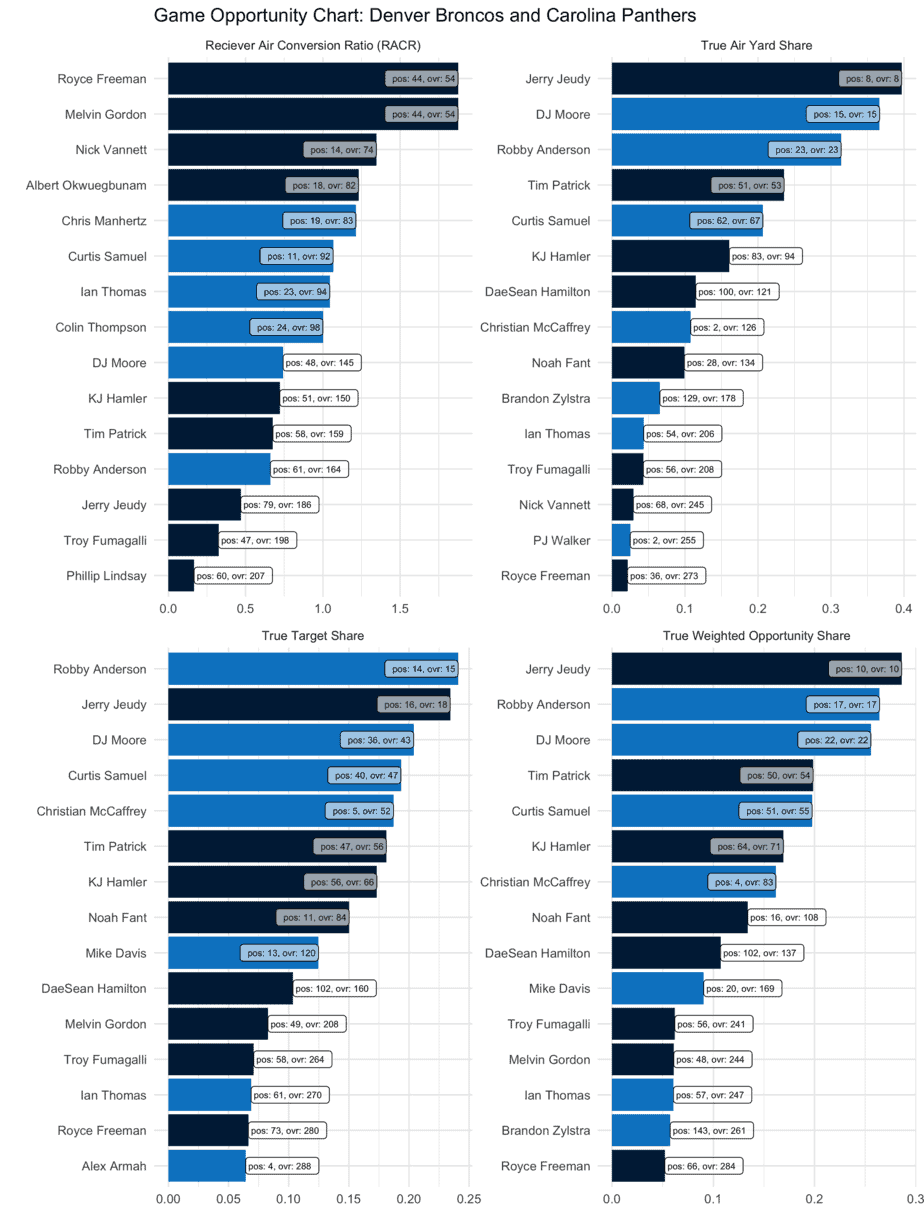
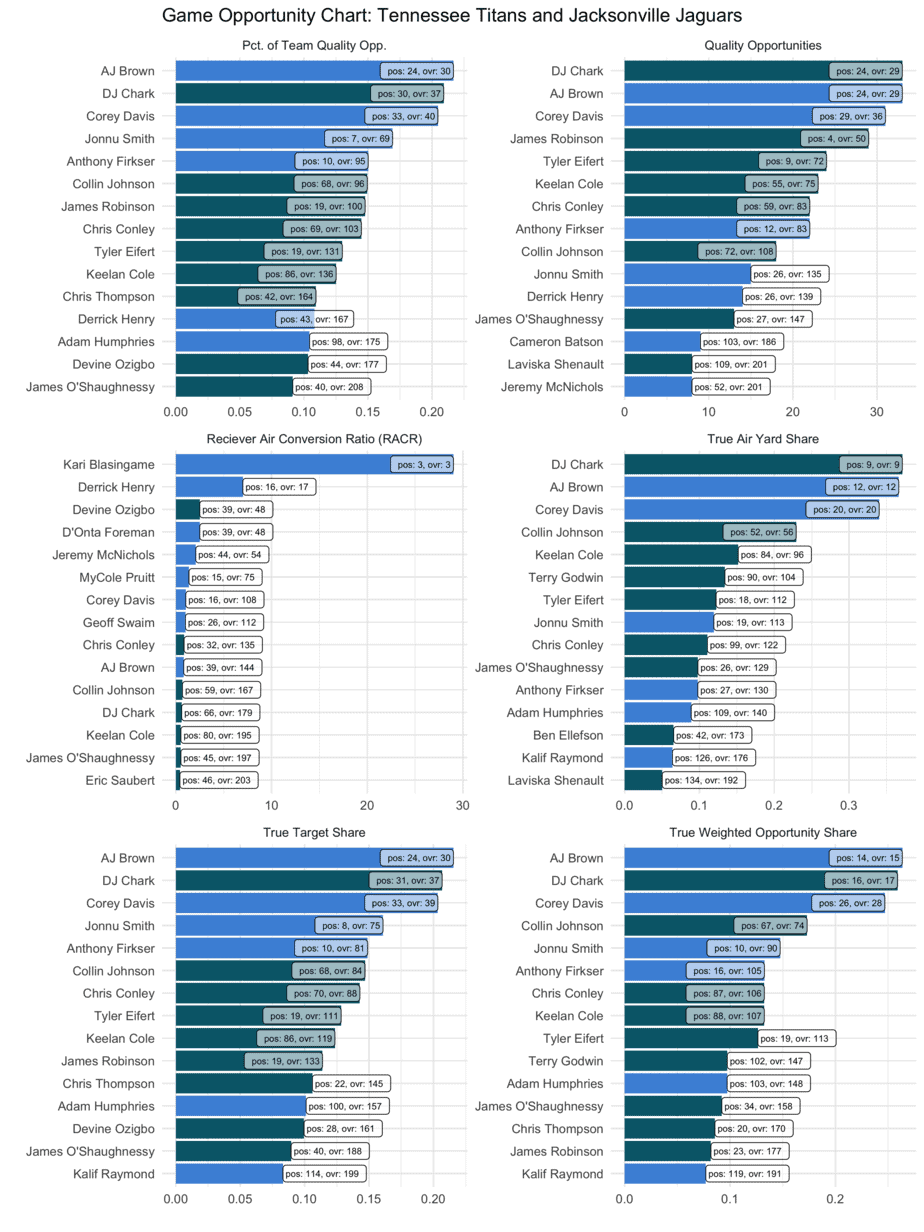
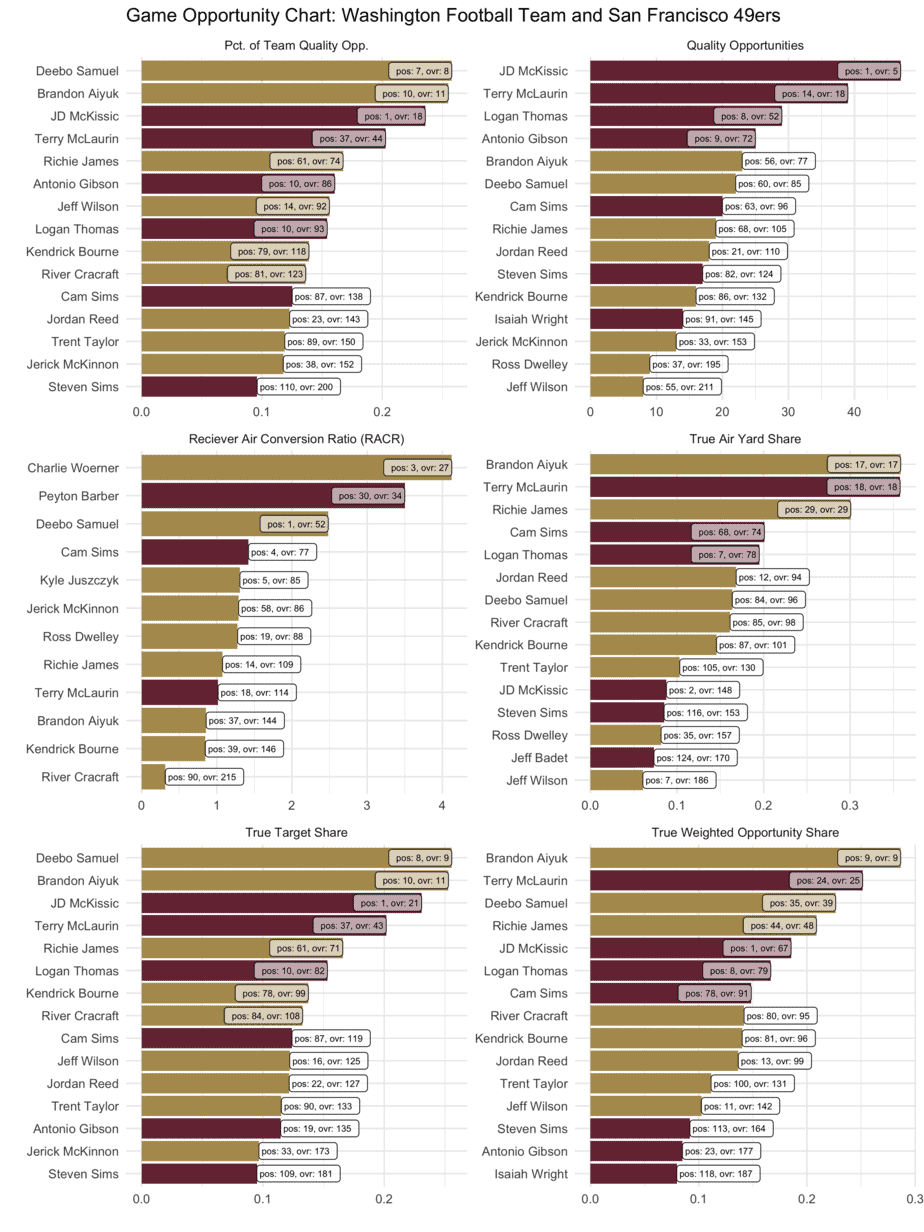
Skill Position Opportunities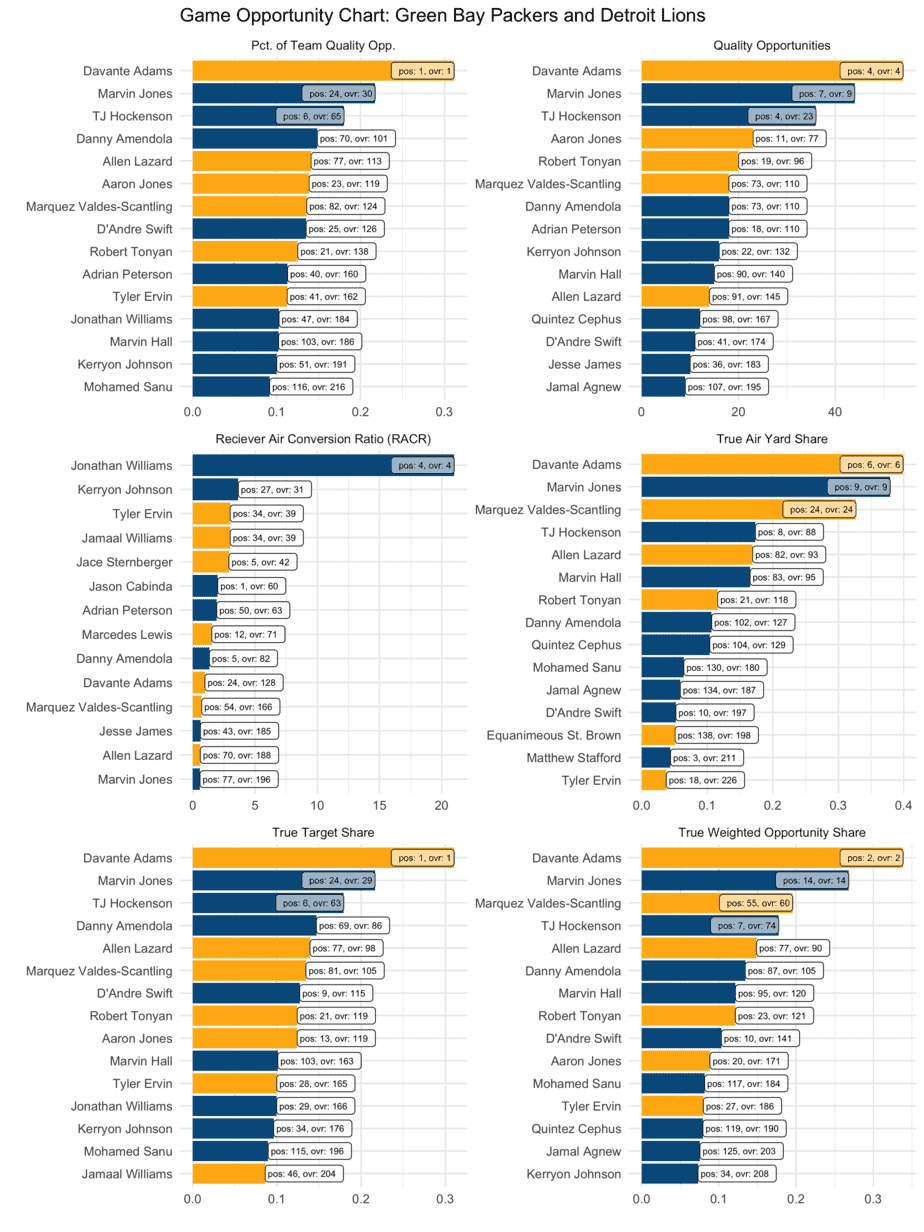
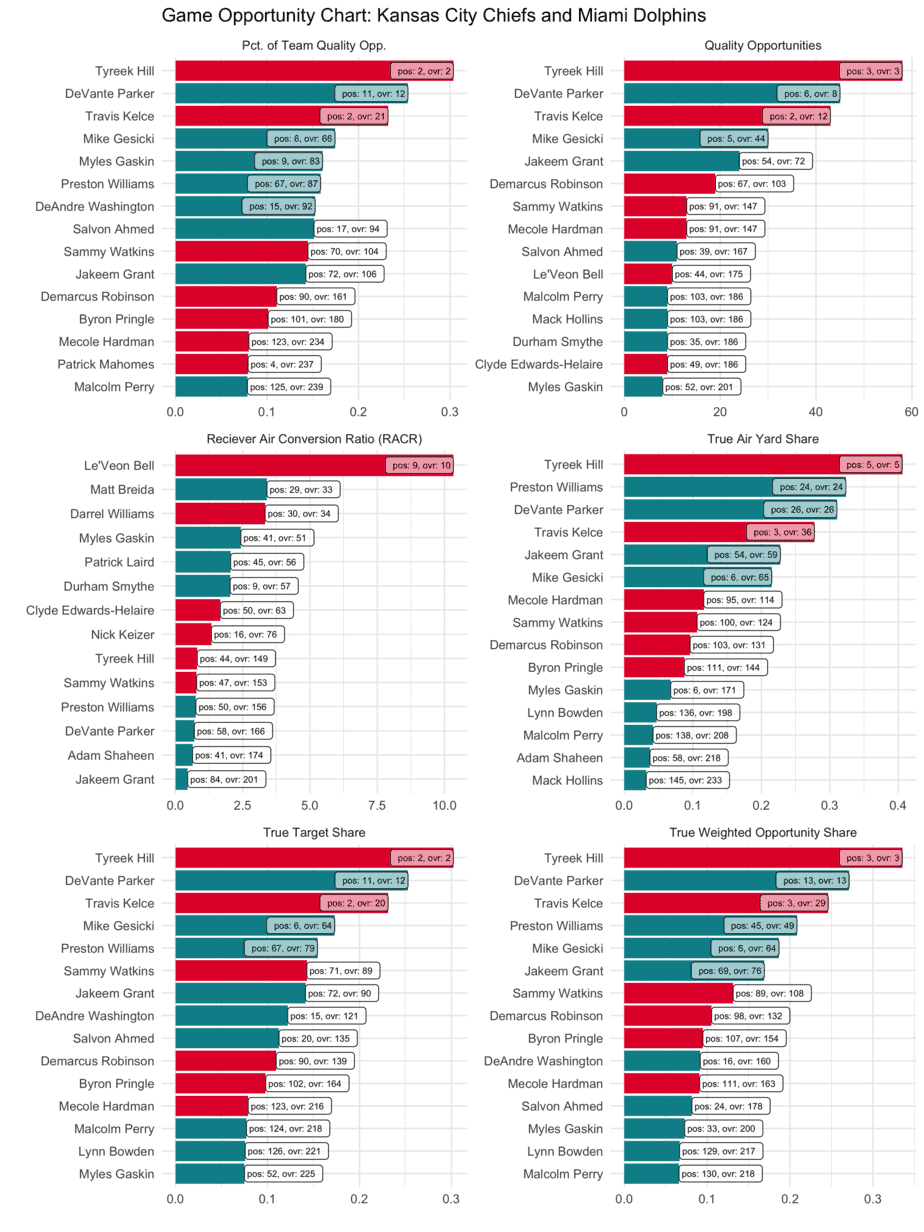
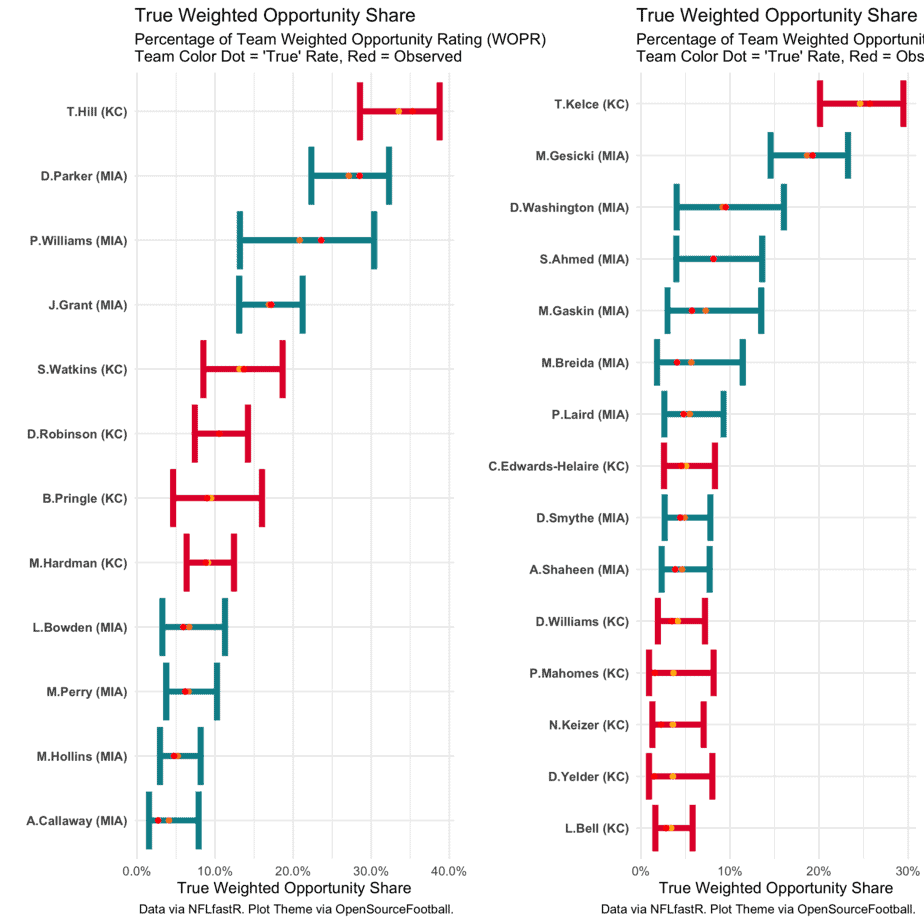
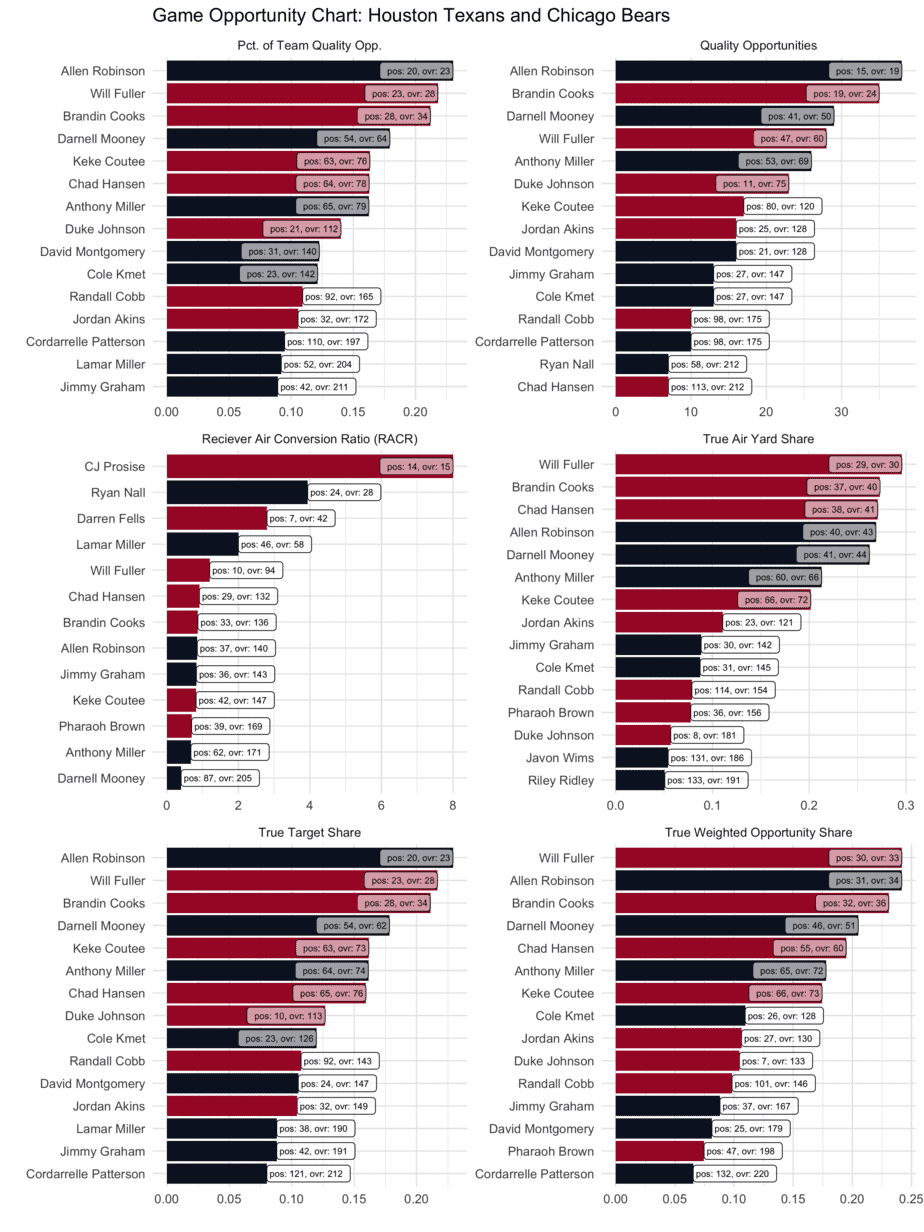
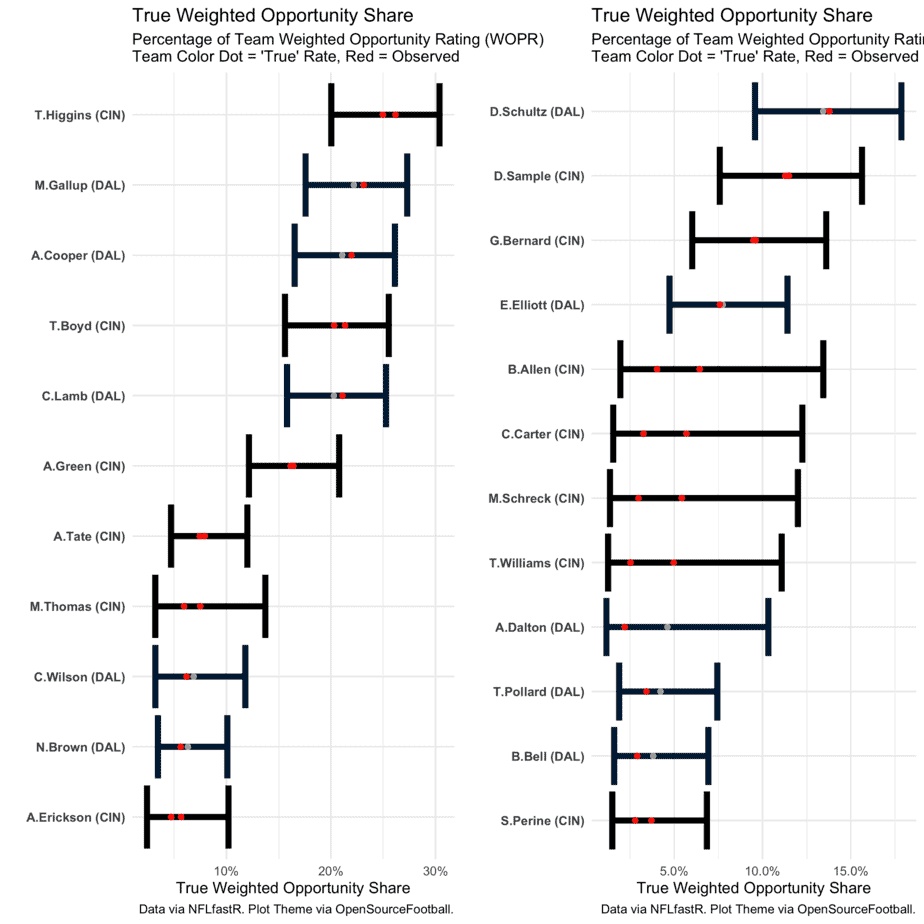
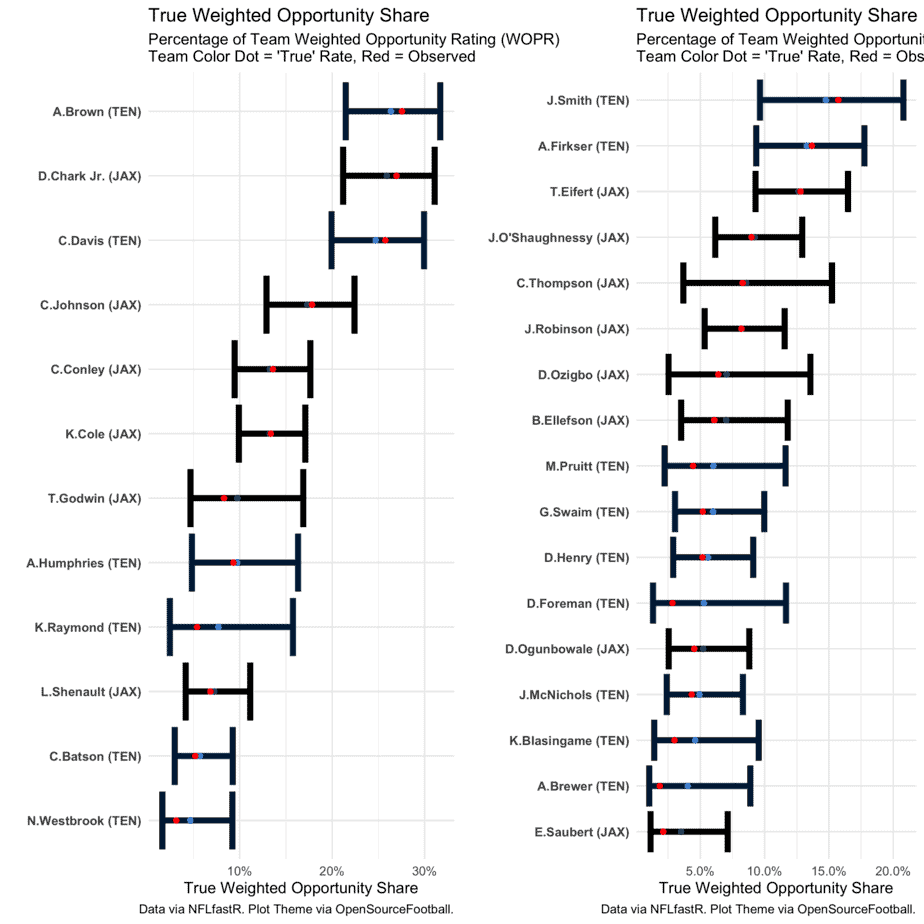
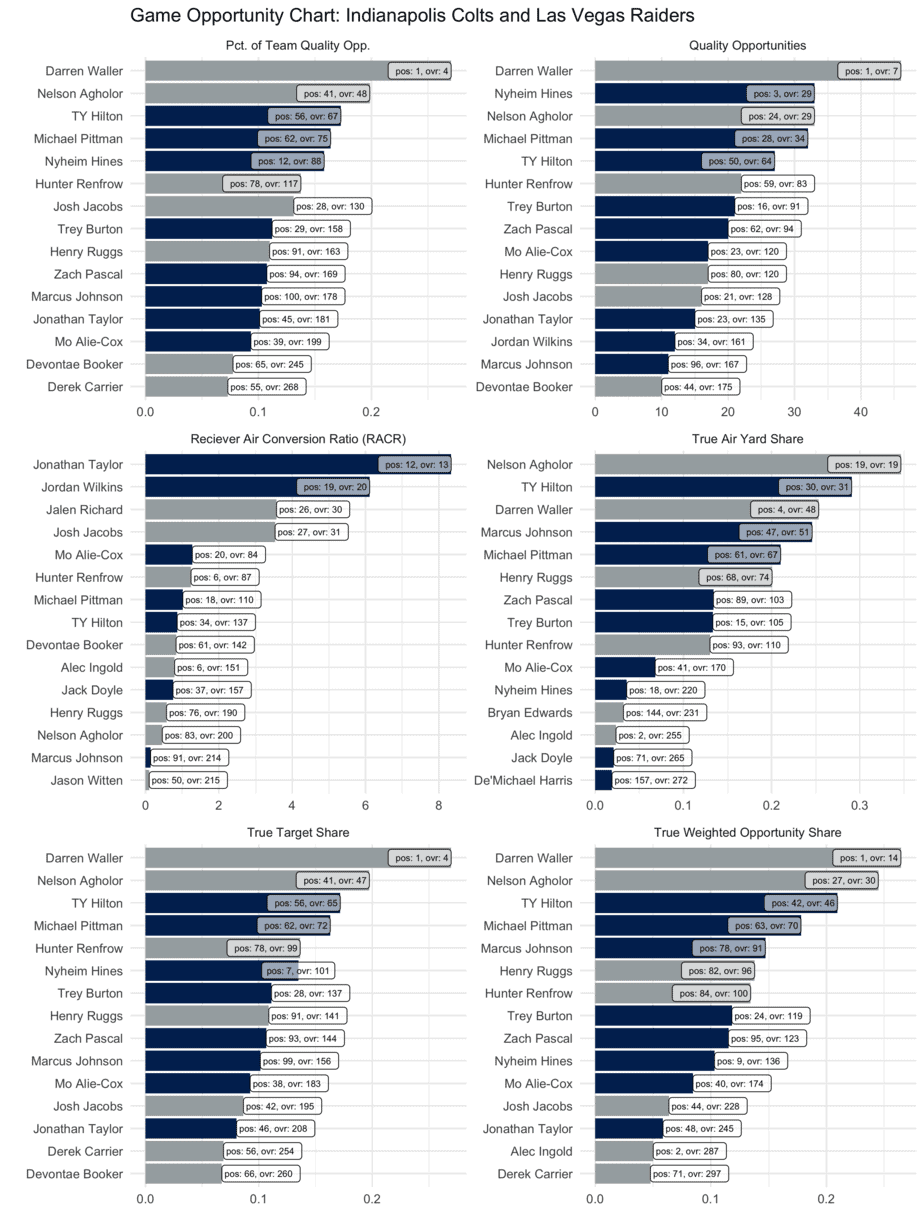
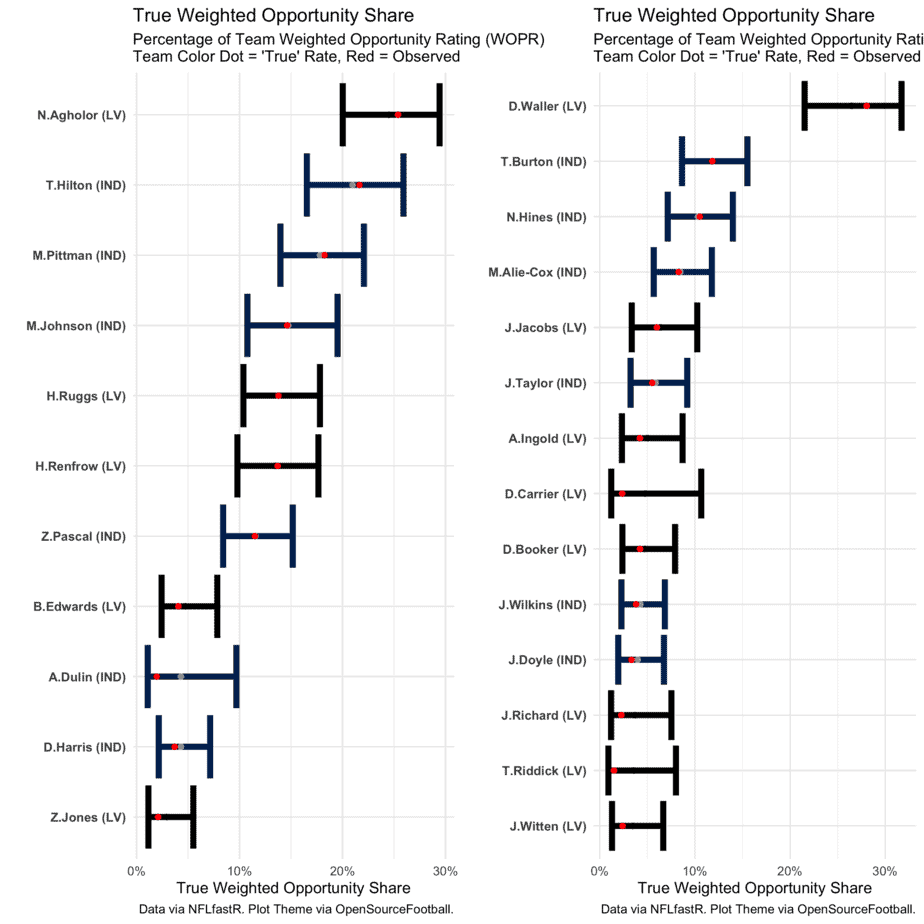
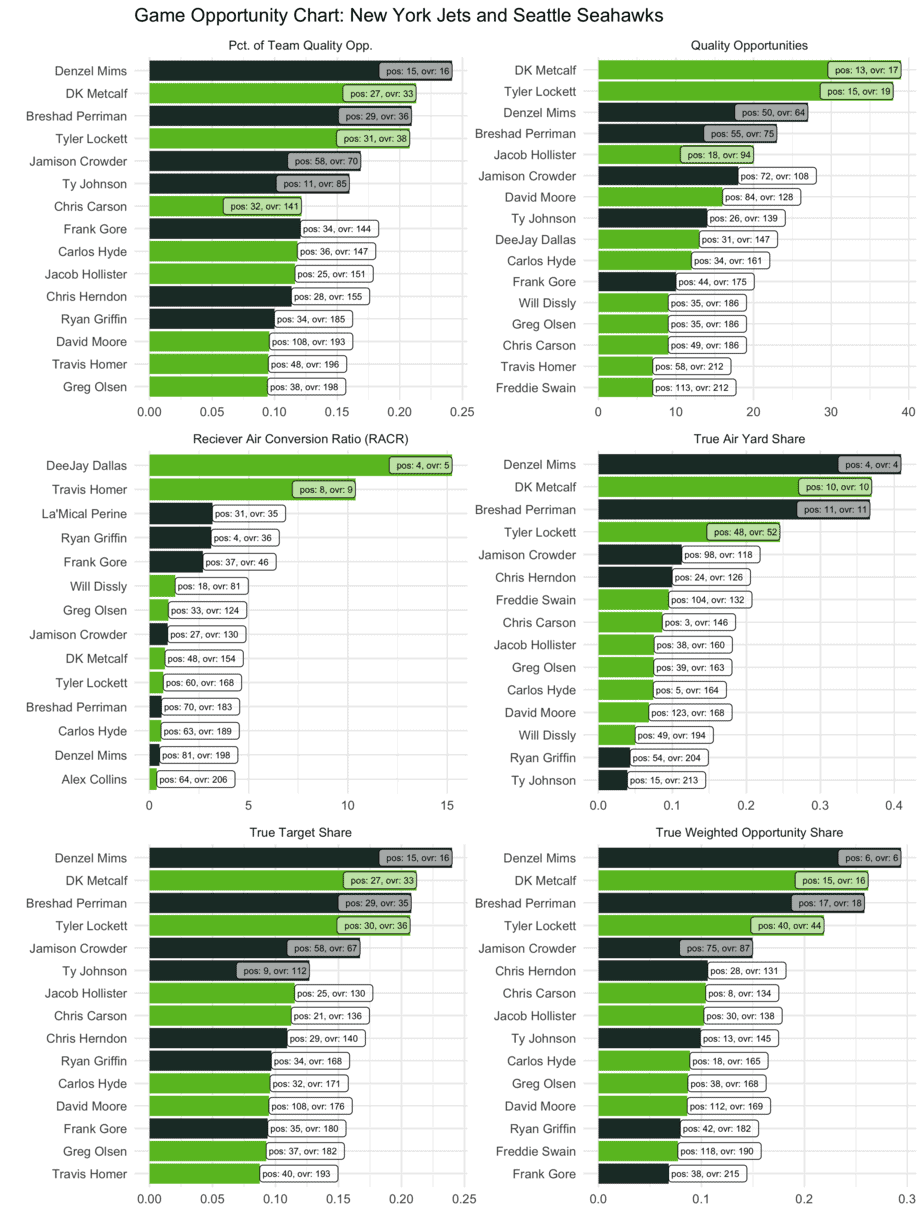
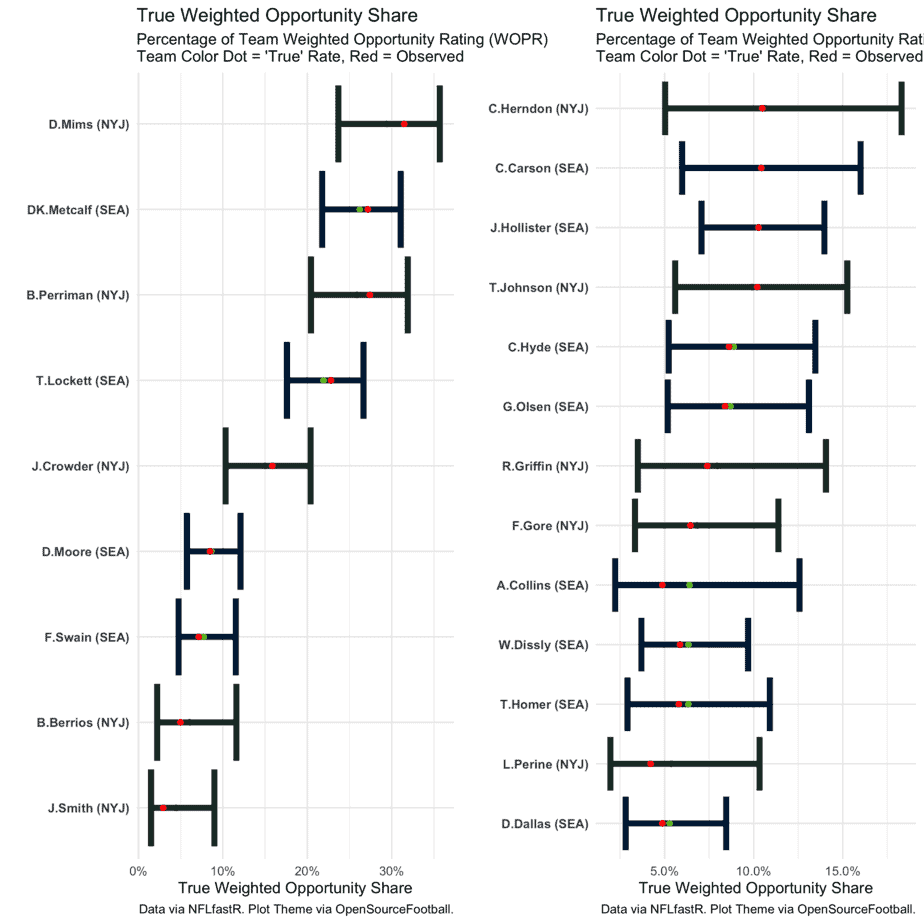
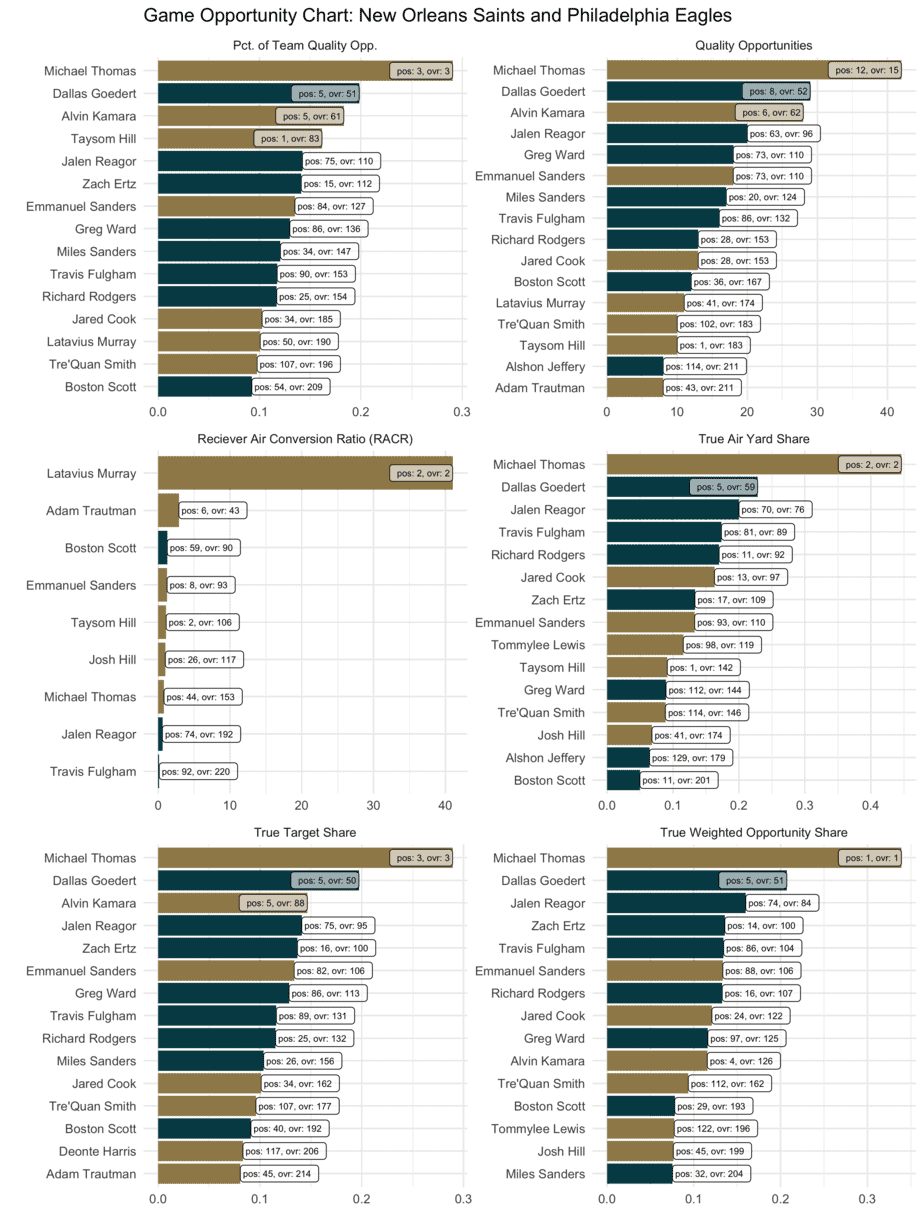
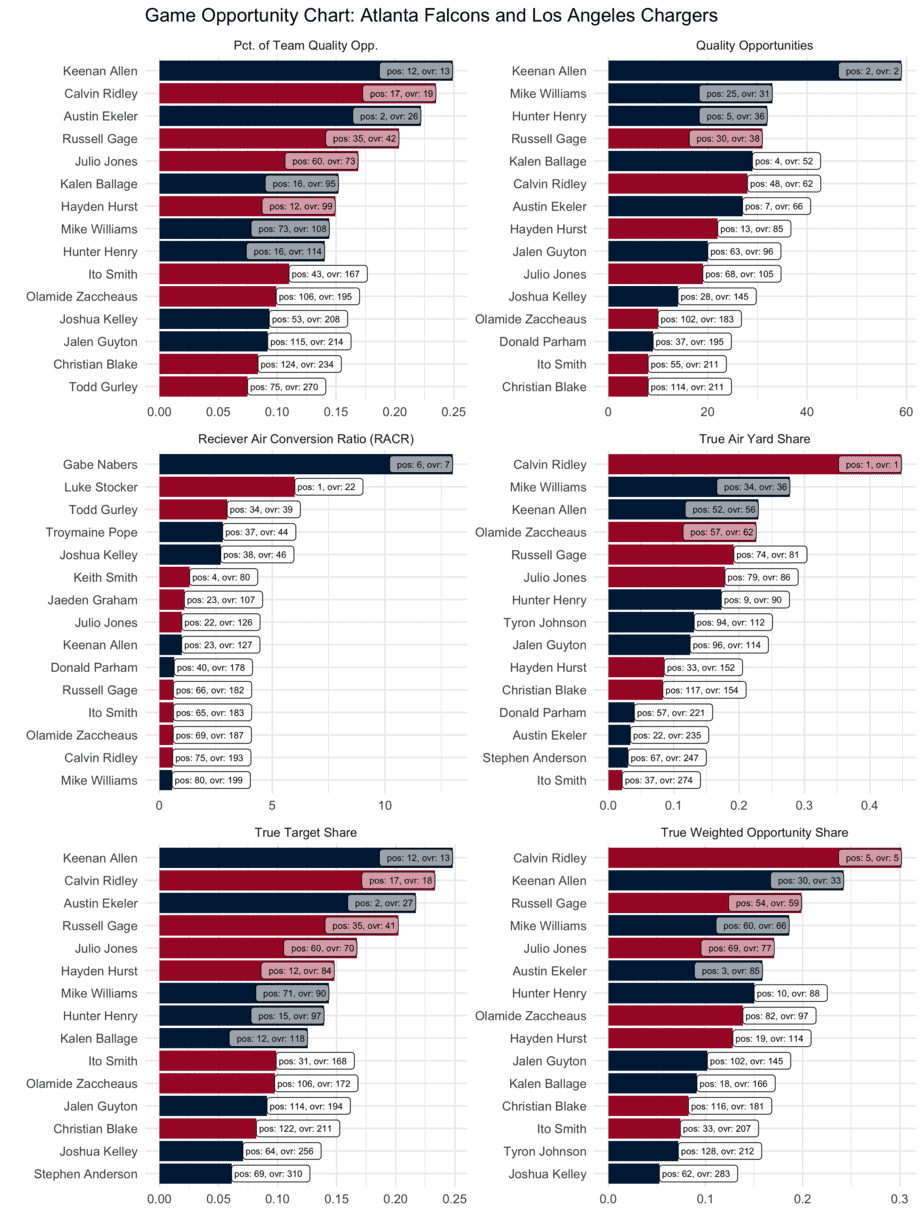
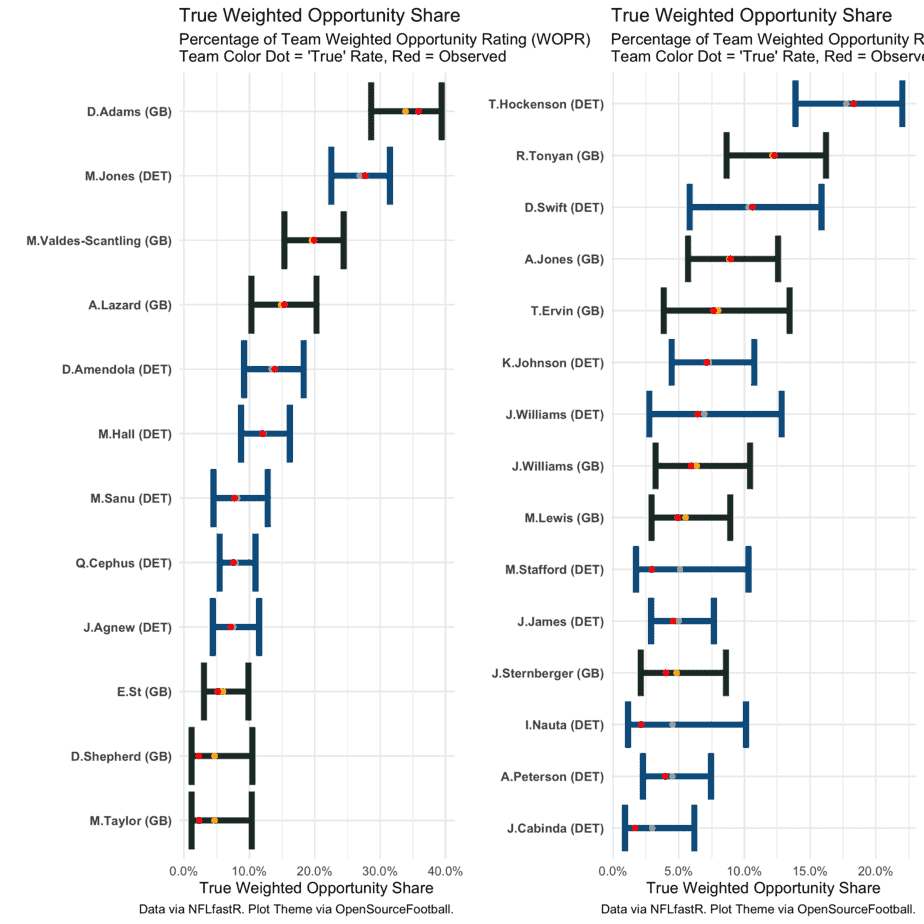
The Game Opportunity Chart is a skill position overview for each matchup. Quality Opportunities and Percentage of Team Quality Opportunities (which is an identical metric to Quality Opportunity Share) is included here, but this chart also includes wide receivers and tight ends to further contextualize running back usage. Receiver air conversion ratio (RACR) is a measure of a receiver’s ability to convert targeted air yards thrown beyond the line of scrimmage into receiving yards (a RACR of 1 indicates a player earns 1 receiving yard per every targeted air yard). True Target Share and True Air Yard Share are key opportunity indicators for receivers and tight ends. They are each regressed based on sample size (hence the “true” distinction in the metric’s name). Finally, True Air Yard Share and True Target Share are combined into one variant metric, True Weighted Opportunity Share, which weighs targets more heavily than air yards.
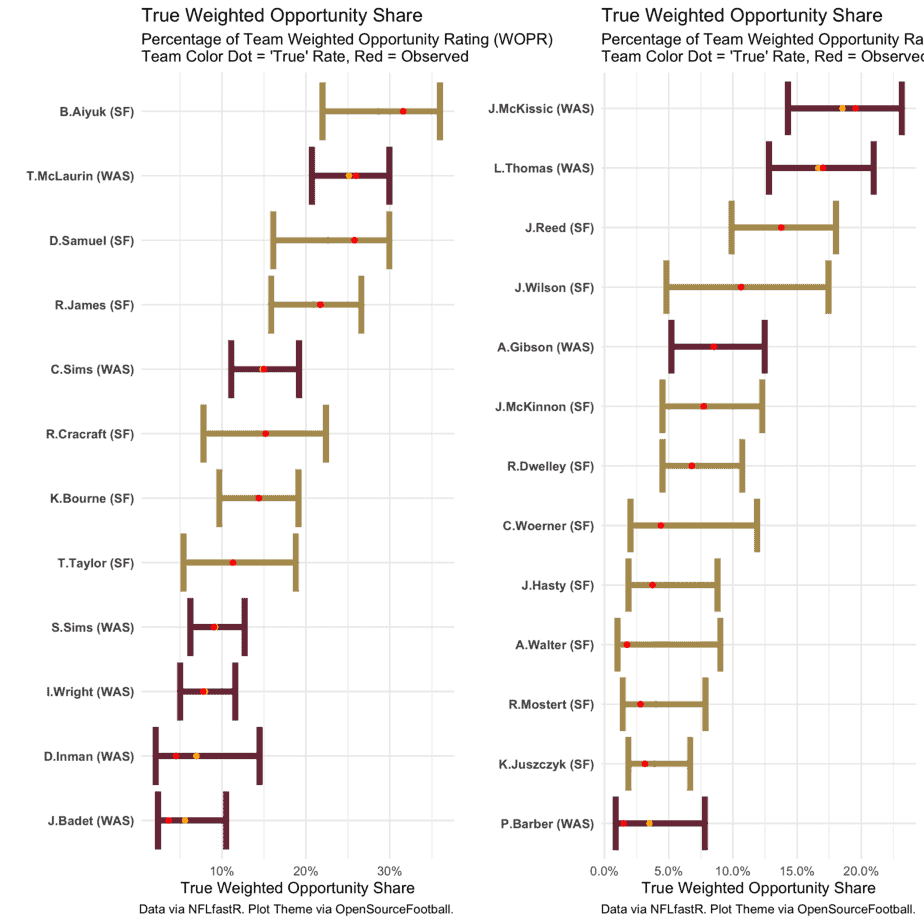
Range of Outcomes Analysis: Receiving Opportunity
Prediction: Chargers 31, Falcons 27
Looking for more NFL DFS picks and daily fantasy football matchups content? We have loads of articles, data and more on the Awesemo NFL home page. Just click HERE.
Follow us on all of our social channels! Check out our Twitter, Facebook, Instagram and YouTube for more great Awesemo content.
Looking for more NFL DFS picks content? We have loads of NFL DFS articles, data, DraftKings and FanDuel cheat sheets and more on the Awesemo NFL home page. Just click HERE.